
Dear Readers welcome to Finance Diary. In this article we will provide the full information about the 35 Powerful Candlestick patterns.
In simple terms, candlesticks are like tools that help experts in the stock market predict where prices might go. These tools show patterns in trading, helping analysts make decisions about buying or selling.
If you are looking for
35 POWERFUL CANDLESTICK PATTERNS
35 POWERFUL CANDLESTICK PATTERNS (FOR FREE)
| E Book Information | Details |
| File Type | |
| File Size | 5.56 MB |
| PDF Quality | Good |
| No. of Pages | 53 |
| Level | Beginner Level |
| Published By | www.financediary.in |
| This Book Price | Price is ₹ 49 only |
| One More Book AvailableFor Advance Level | Price is ₹ 49 only |
| Contact | Finacediary@outlook.com |
Imagine candlesticks as special glasses that let you see what’s happening in the market. They reveal things like how strong the market is, which way it’s going, and even how people’s feelings affect these trends.
On a chart, each candlestick shows the price of something (like a stock) for a specific time, maybe a day or an hour. The patterns are created by looking at how two or more candlesticks are arranged. Interestingly, even just one candlestick can sometimes give a powerful signal.
Now, let’s break down what a candlestick is made of and what it tells us. Keep in mind that the details might change based on how long you’re looking at the chart – whether it’s a whole day, an hour, and so on.
In this guide, we’re going to explore 35 strong candlestick patterns. But before we dive into that, let’s first understand how to read these candlestick charts.
UNDERSTANDING CANDLESTICK CHARTS MADE EASY
Candlestick charts have been around for a long time, way before the West came up with their bar charts and point-and-figure charts. They actually originated in Japan over 100 years ago.
A clever Japanese man named Homma discovered something interesting just like there’s a connection between the price of rice and its supply and demand, the markets are also strongly influenced by how traders feel.
Now, let’s talk about the basics of reading a daily candlestick chart. This chart shows the open, high, low, and close prices of something (like a stock) for a day.
Imagine the wide or rectangle part of the candlestick as the “real body.” This part tells us about the connection between the opening and closing prices.
If this real body is filled, black, or red, it means the close is lower than the open. This is called a bearish candle, suggesting that prices opened, the bears pushed them down, and they closed lower than where they started.
On the other hand, if the real body is empty, white, or green, it means the close was higher than the open. This is a bullish candle, indicating that prices opened, the bulls pushed them up, and they closed higher than the opening price.
Now, look at the thin vertical lines above and below the real body – these are the wicks or shadows. They represent the high and low prices during the trading session. The upper shadow shows the highest price, and the lower shadow shows the lowest price reached during that session. It’s like a snapshot of the day’s ups and downs.
UNDERSTANDING CANDLESTICK CHARTS: A QUICK GUIDE
Before we dive into the world of different candlestick charts, let’s keep a couple of things in mind that are specific to these charts.
Imagine strength like a superhero – it’s represented by a bullish or green candle. Weakness, on the other hand, is like a not-so-happy day and is shown by a bearish or red candle.
So, when you’re thinking of buying something, make sure it’s a green candle day. And when you are in the mood to sell, look for that red candle day.
Now, textbooks might give a super strict definition of a pattern, but it’s important to know that there could be slight changes to the pattern depending on what’s going on in the market. It’s like saying, “Hey, the plan is this, but sometimes we might tweak it a bit based on how things are.”
Lastly, it’s like detective work – you should always look for a prior trend. If you’re hoping for a bullish reversal pattern (meaning prices might go up), the trend before should be bearish (prices were going down).
If it’s a bearish reversal pattern (expecting prices to go down), then the prior trend should be bullish (prices were on the rise). It’s like figuring out the story of the market before making any big decisions.
Let’s Explore 35 POWERFUL CANDLESTICK PATTERNS
Candlestick patterns can be put into three groups:
Continuation Patterns
Bullish Reversal Patterns
Bearish Reversal Patterns
Now, let’s check out the 35 Powerful Candlestick patterns, each falling into one of the categories mentioned above.
BULLISH REVERSAL CANDLESTICK PATTERNS: SIGNS OF A POSITIVE CHANGE
When you see Bullish Reversal candlestick patterns, it’s like a signal that the downward trend might be switching to an upward one.
For traders, especially those with short positions, it’s a heads-up. These patterns suggest that it might be time to reconsider those short bets.
Let’s take a look at the various types of Bullish Reversal candlestick patterns:
01. HAMMER CANDLESTICK PATTERN
A Hammer is a simple candlestick pattern that appears at the conclusion of a downtrend, suggesting a potential shift towards a bullish reversal.
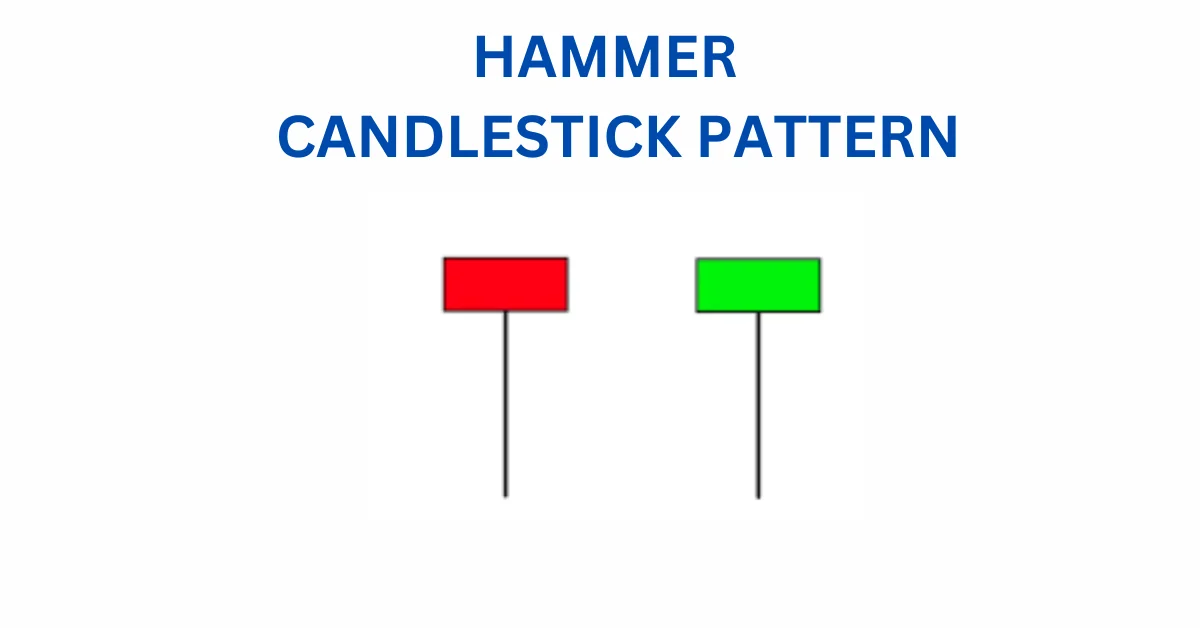
Here’s how you can recognize it:
The candle has a small real body situated at the top.
It comes with a lower shadow that is more than twice the size of the real body.
There is little to no upper shadow.
What’s happening here?
Prices open, and sellers initially drive them down.
Suddenly, buyers’ step in and boost the prices, closing the trading session higher than the opening price.
What does it indicate?
This pattern suggests a bullish reversal. It signals that buyer have re-entered the market, possibly marking the end of the downtrend.
For traders:
Consider entering a long position if the next day forms a bullish candle. To manage risk, you can place a stoploss order at the low point of the Hammer candlestick.
Among the 35 powerful candlestick patterns, HAMMER CANDLESTICK PATTERN stands out as one of them.
02. PIERCING CANDLESTICK PATTERN
The Piercing Pattern is a candlestick chart pattern made up of two candles, suggesting a potential bullish reversal after a downtrend.
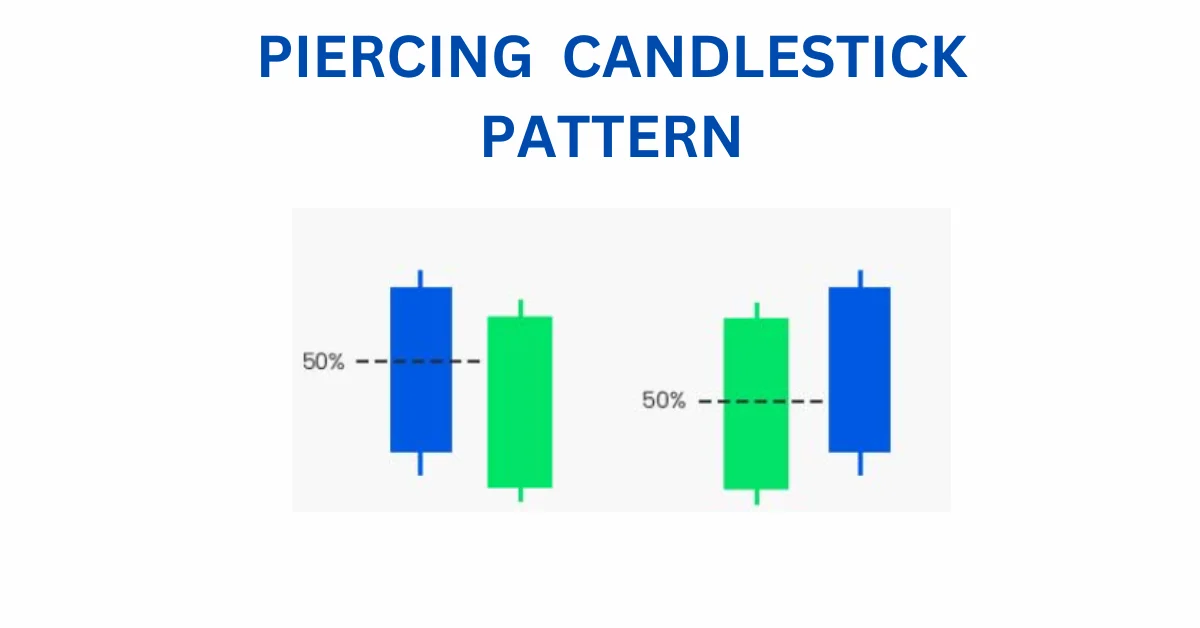
Here’s how it works:
- The first candle is bearish, signalling the continuation of the downtrend.
- The second candle is bullish, opening lower but closing more than 50% above the real body of the previous candle.
What does this mean?
The appearance of the Piercing Pattern indicates that despite the initial downtrend, the bulls are gaining strength, and a reversal to a bullish market might occur.
For traders:
Consider entering a long position if the next day forms a bullish candle. To manage risk, you can place a stop-loss order at the low point of the second candle in the pattern.
Among the 35 powerful candlestick patterns, PIERCING CANDLESTICK PATTERN stands out as one of them.
03. BULLISH ENGULFING
The Bullish Engulfing is a candlestick chart pattern that suggests a potential bullish reversal after a downtrend. It involves two candles and here’s how it works:
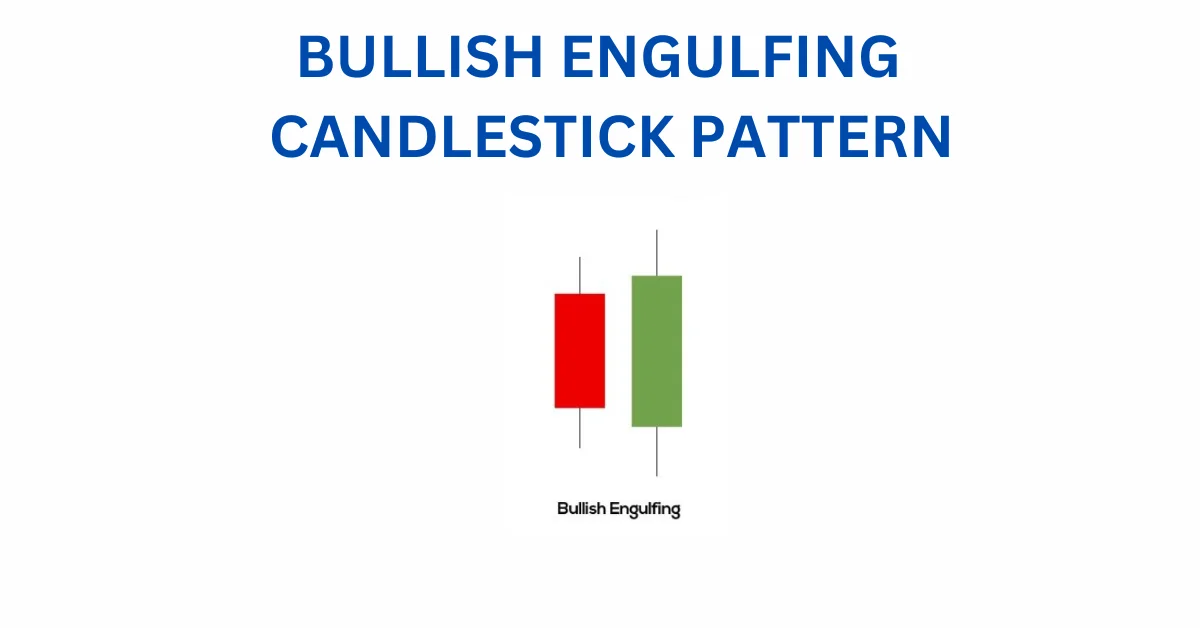
- The first candle is bearish, signalling the continuation of the downtrend.
- The second candle is a long bullish one that completely engulfs the first candle. This indicates a strong shift in market sentiment, with the bulls taking control.
For traders:
Consider entering a long position if the next day forms a bullish candle. To manage risk, you can place a stop-loss order at the low of the second candle in the pattern.
Among the 35 powerful candlestick patterns, BULLISH ENGULFING CANDLESTICK PATTERN stands out as one of them.
ALSO READ
11 BEST PAPER TRADING APPS IN INDIA
04. THE MORNING STAR
The Morning Star is a candlestick chart pattern suggesting a potential bullish reversal after a downtrend. This pattern involves three candles, and here’s how it works:
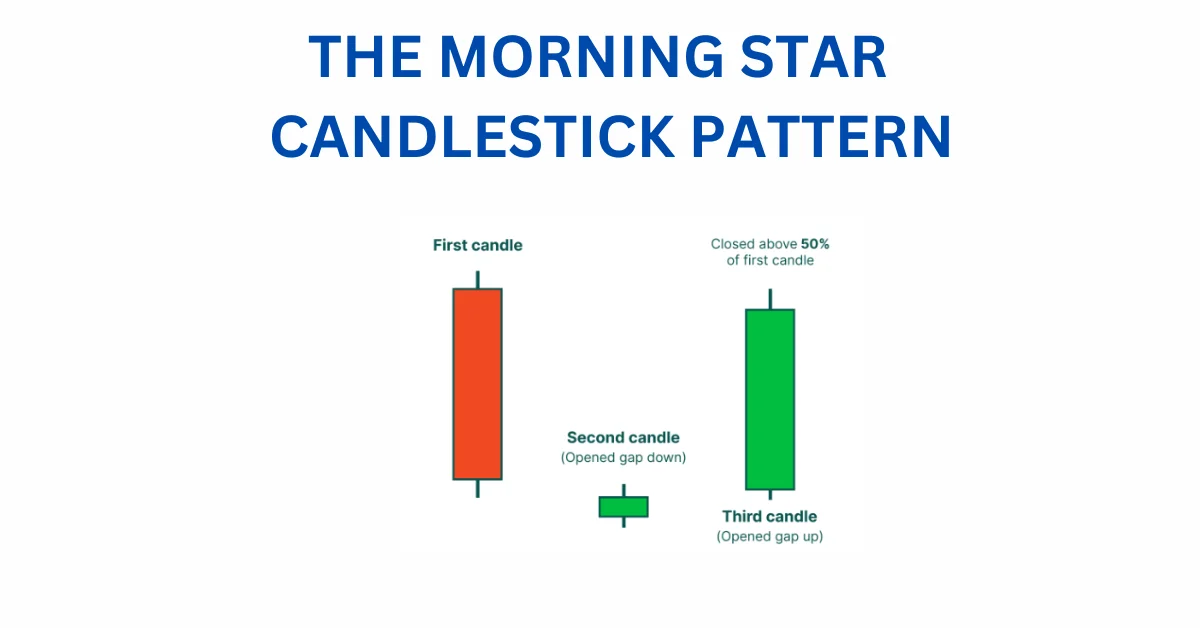
- The first candle is bearish, indicating the continuation of the downtrend.
- The second candle is a Doji, signalling indecision in the market.
- The third candle is a bullish one, demonstrating that the bulls are gaining control, and a reversal may occur.
Key points:
The second candle should be completely outside the real bodies of the first and third candles.
For traders:
Consider entering a long position if the next day forms a bullish candle. To manage risk, you can place a stop-loss order at the low of the second candle in the pattern.
Among the 35 powerful candlestick patterns, THE MORNING STAR CANDLESTICK PATTERN stands out as one of them.
05. THREE WHITE SOLDIERS
The Three White Soldiers is a candlestick pattern suggesting a potential bullish reversal after a downtrend. Here’s how it works:
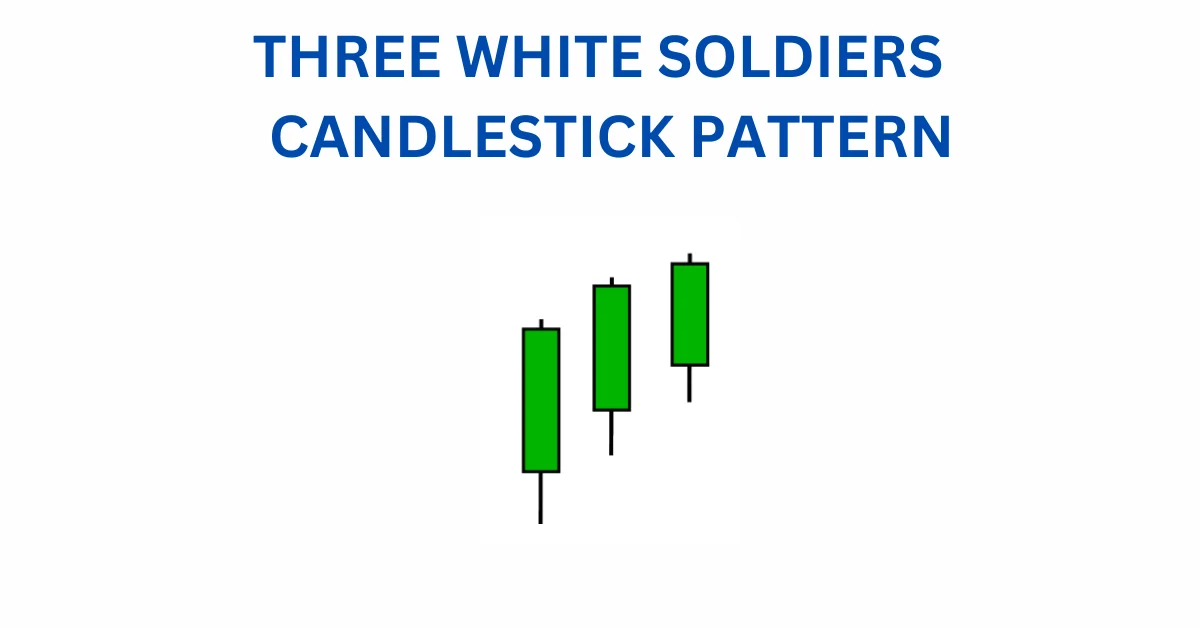
The pattern consists of three consecutive long bullish bodies.
These bullish bodies should not have long shadows.
Each candle should open within the real body of the previous candle in the pattern.
For traders
This pattern indicates a shift towards a bullish trend. If you see Three White Soldiers after a downtrend, it may suggest that the bulls are taking control. Consider this when making trading decisions.
06. WHITE MARUBOZU
The White Marubozu is a single candlestick pattern signaling a potential bullish reversal after a downtrend. Here’s what it means:
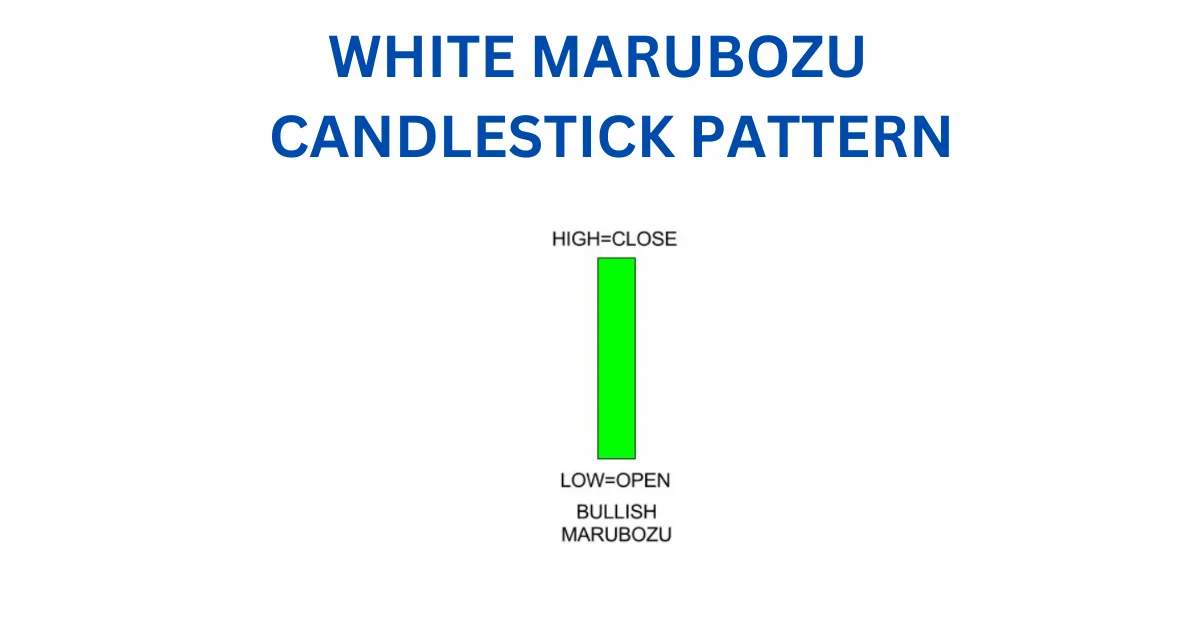
It consists of a single candle with a long bullish body.
There are no upper or lower shadows, indicating strong buying pressure from the bulls.
This pattern suggests a shift towards a bullish market sentiment.
For traders:
When you spot a White Marubozu after a downtrend, it may indicate a potential reversal. Sellers might want to be cautious and consider closing their short positions.
07. THREE INSIDE UP
The Three Inside Up is a pattern that suggests a potential shift from a downtrend to a bullish reversal. Here’s a breakdown in simpler terms:
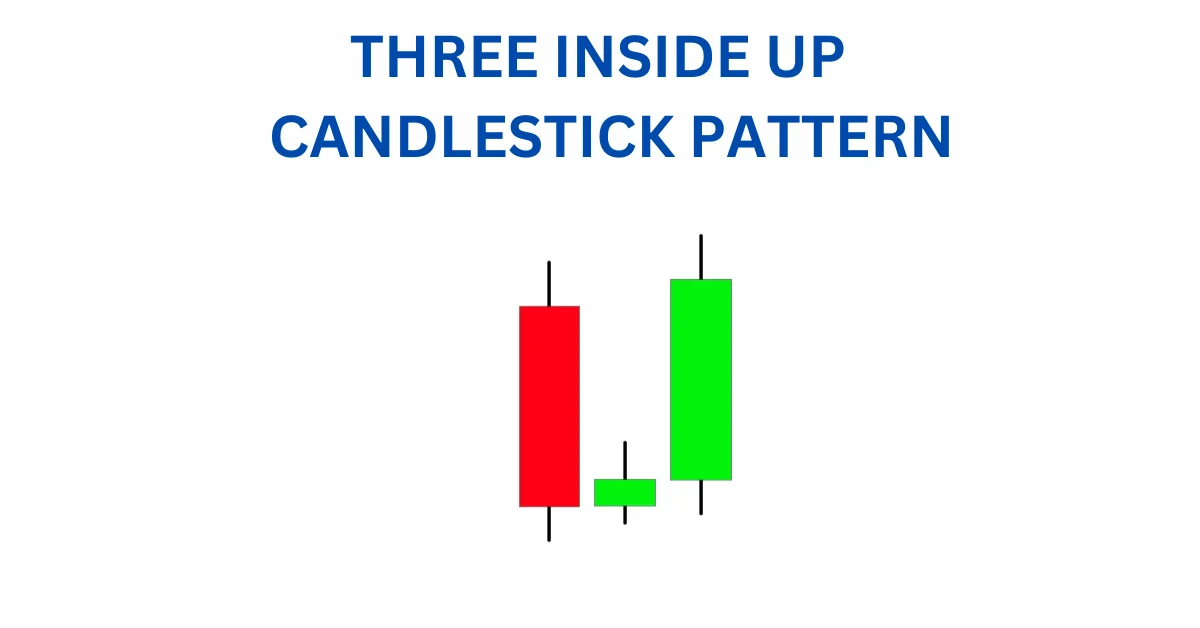
It involves three candlesticks.
The first is a long bearish candle, indicating a downtrend.
The second is a small bullish candle, nestled within the range of the first candle.
The third is a long bullish candle, confirming the potential reversal.
A key point:
The relationship between the first and second candlestick resembles the bullish harami pattern, adding to the bullish signal.
For traders:
Consider going for a long position after you see this pattern complete.
08. BULLISH HARAMI
The Bullish Harami is a pattern suggesting a shift from a downtrend to a potential bullish reversal. Let’s simplify:
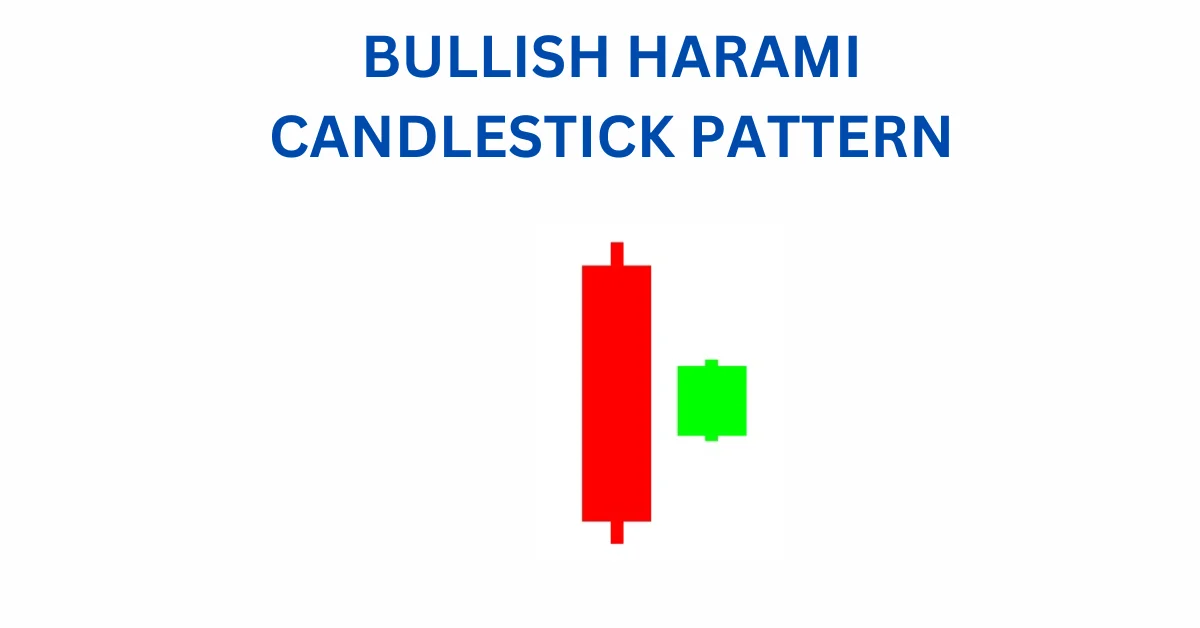
It involves two candlesticks.
The first is a tall bearish candle, indicating the ongoing downtrend.
The second is a small bullish candle, nestled within the range of the first candle.
What it signifies:
The first bearish candle shows the continuation of the bearish trend, but the small bullish candle that follows indicates the possibility of the bulls returning to the market.
For traders:
Consider going for a long position once this candlestick pattern is complete.
09. TWEEZER BOTTOM
The Tweezer Bottom is a bullish reversal candlestick pattern signaling a potential change in direction after a downtrend. Let’s break it down:
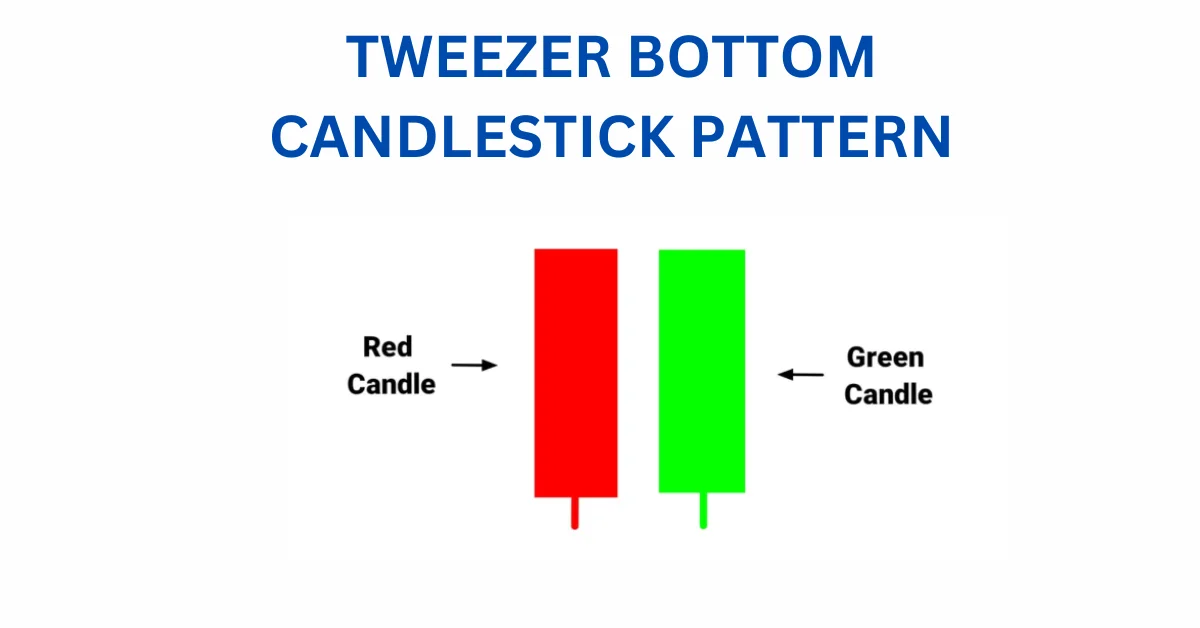
It involves two candlesticks.
The first is bearish (representing a downtrend).
The second is bullish.
Key points:
Both candlesticks have almost the same low.
When the Tweezer Bottom pattern appears, the prior trend is a downtrend.
The first day shows a bearish candle, suggesting a continuation of the downtrend.
The second day’s bullish candle has a low that acts as a support level.
What happens:
The almost identical lows indicate strong support.
This signals that the downtrend might reverse, and the bulls take action to push the price upward.
The bullish reversal is confirmed the next day when another bullish candle is formed.
10. INVERTED HAMMER
The Inverted Hammer is a candlestick pattern that appears at the conclusion of a downtrend, indicating a potential shift to a bullish trend.
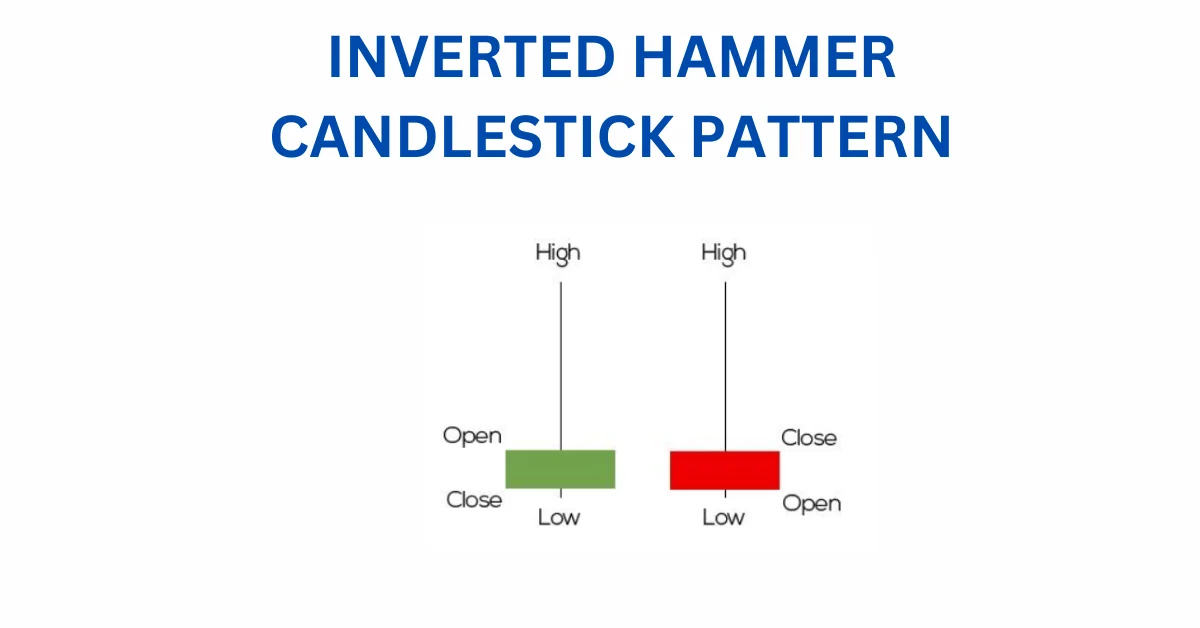
Let’s simplify:
It signals a bullish reversal.
It’s like the opposite of the Hammer Candlestick pattern.
Key points:
The real body is at the top.
There’s a long upper shadow.
It forms when opening and closing prices are close, and the upper shadow is more than twice the real body.
11. THREE OUTSIDE UP
The Three Outside Up is a pattern made up of three candles, and it suggests a shift from a downtrend to a potential uptrend.
Let’s break it down:
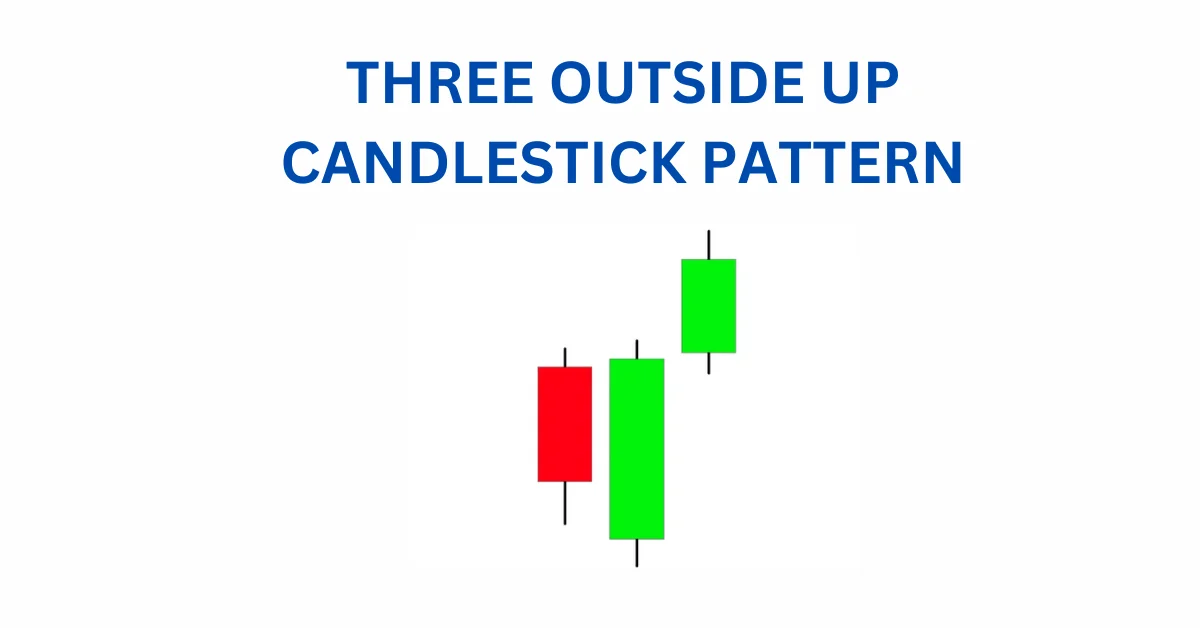
It signals a bullish reversal.
It consists of three candles.
The first is a small bearish candle.
The second is a big bullish candle that covers the first one.
The third is another long bullish candle, confirming the reversal.
The relationship between the first and second candles is similar to the Bullish Engulfing pattern.
Traders might consider going for a long position when they see this candlestick pattern complete.
12. ON NECK PATTERN
The On Neck pattern appears after a downtrend. Here’s how it works:
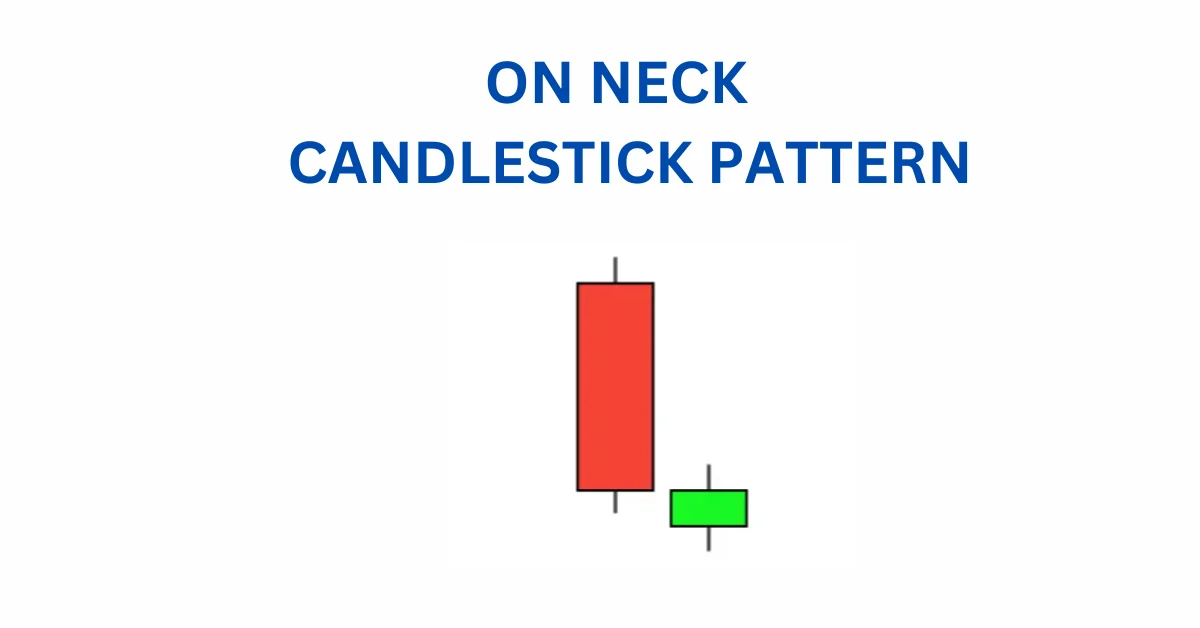
First, there’s a long bearish candle.
Next, there’s a smaller bullish candle that starts with a gap down but ends up closing near the previous candle’s close.
The term “neckline” comes from the fact that the closing prices of these two candles are nearly the same, forming a straight line.
13. BULLISH COUNTERATTACK
The Bullish Counterattack is a pattern that signals a potential reversal from a downtrend to an uptrend. Here’s how it works:
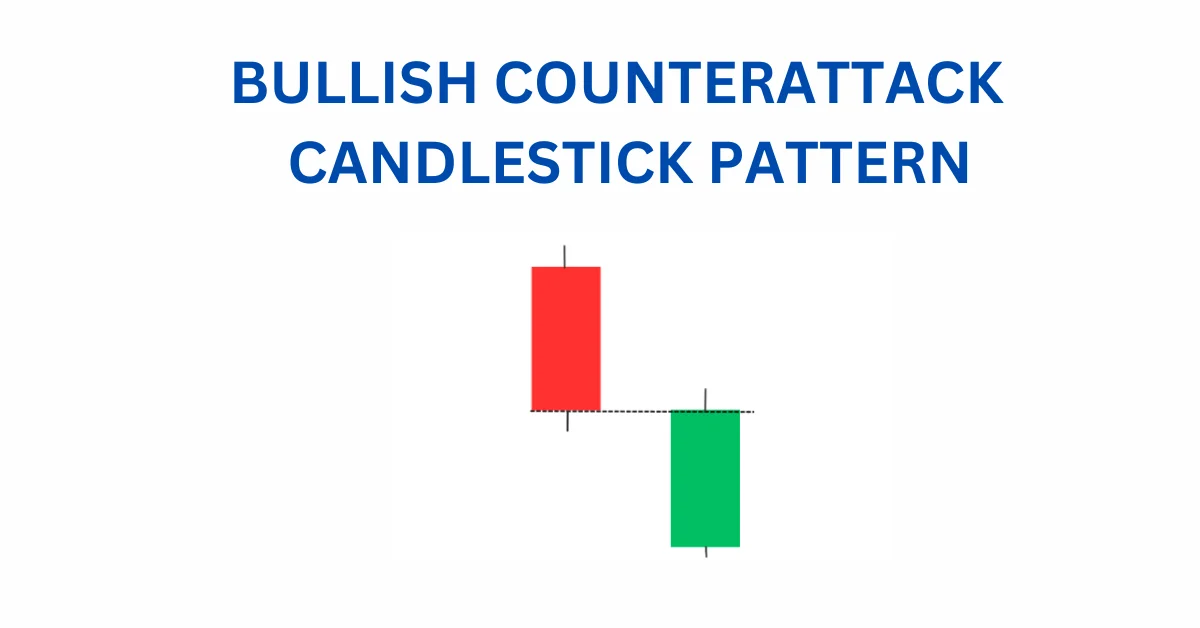
It appears during a strong downtrend.
The first candle is a long black candle.
The second candle, ideally as long as the first, is white and closes near the first candle’s close.
This pattern suggests a shift in momentum towards a potential upward trend.
BEARISH CANDLESTICK PATTERN
Bearish Reversal candlestick patterns show that the current upward trend is likely to turn into a downtrend. Here’s what you need to know:
Traders need to be careful with their long positions when they see these bearish reversal candlestick patterns.
Let’s explore the various types of bearish reversal candlestick chart patterns:
14. HANGING MAN
The Hanging Man is a single candlestick pattern seen at the end of an uptrend, suggesting a potential bearish reversal. Here’s a simple breakdown:
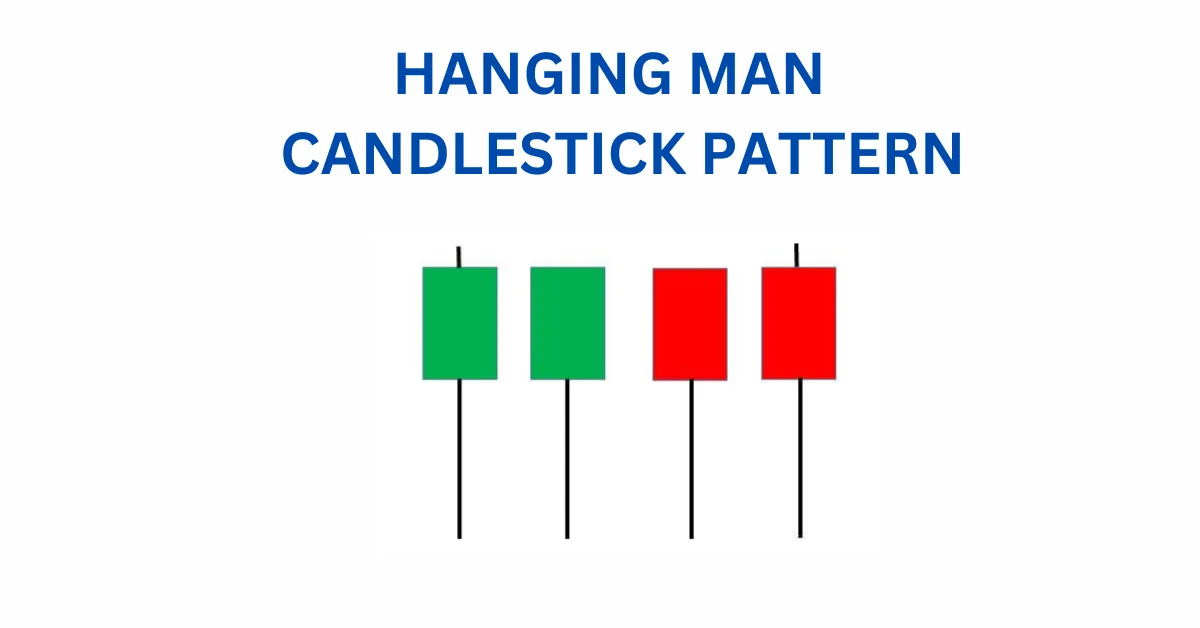
This candle has a small body positioned at the top with a lower shadow more than twice the size of the body. It usually lacks an upper shadow.
The psychology behind this candle goes like this:
Prices open, sellers push them down.
Buyers step in, attempting to push prices up, but they fail, and the prices close below the opening.
This creates a bearish pattern, indicating that sellers are gaining control, and the uptrend might be ending. If the next day forms a bearish candle, traders might consider entering a short position, placing a stoploss at the high of the Hanging Man.
15. DARK CLOUD COVER
The Dark Cloud Cover is a candlestick pattern that appears after an uptrend, signalling a potential bearish reversal. Here’s a simpler explanation:
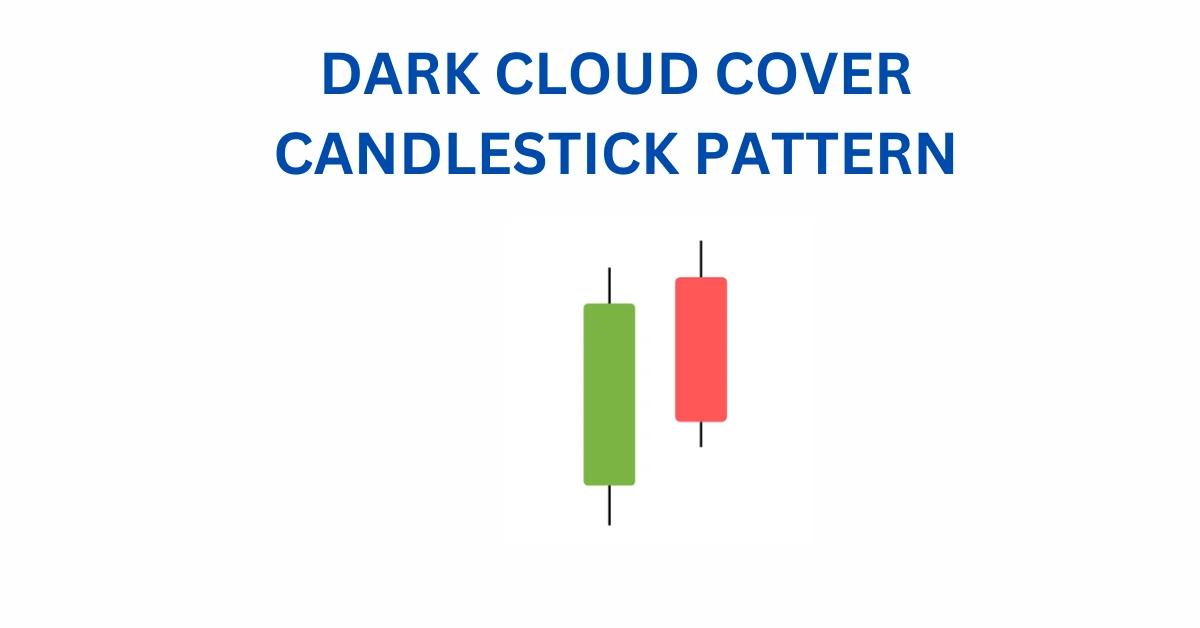
It consists of two candles.
The first one is bullish, suggesting the uptrend will continue.
The second candle is bearish, opening with a gap up but closing more than 50% down the previous candle’s real body.
This indicates a shift, with bears gaining strength and a possible bearish reversal. Traders might consider entering a short position if the next day forms a bearish candle, placing a stoploss at the high of the second candle.
16. BEARISH ENGULFING
The Bearish Engulfing is a candlestick pattern signaling a possible bearish reversal after an uptrend. Here’s a simpler breakdown:
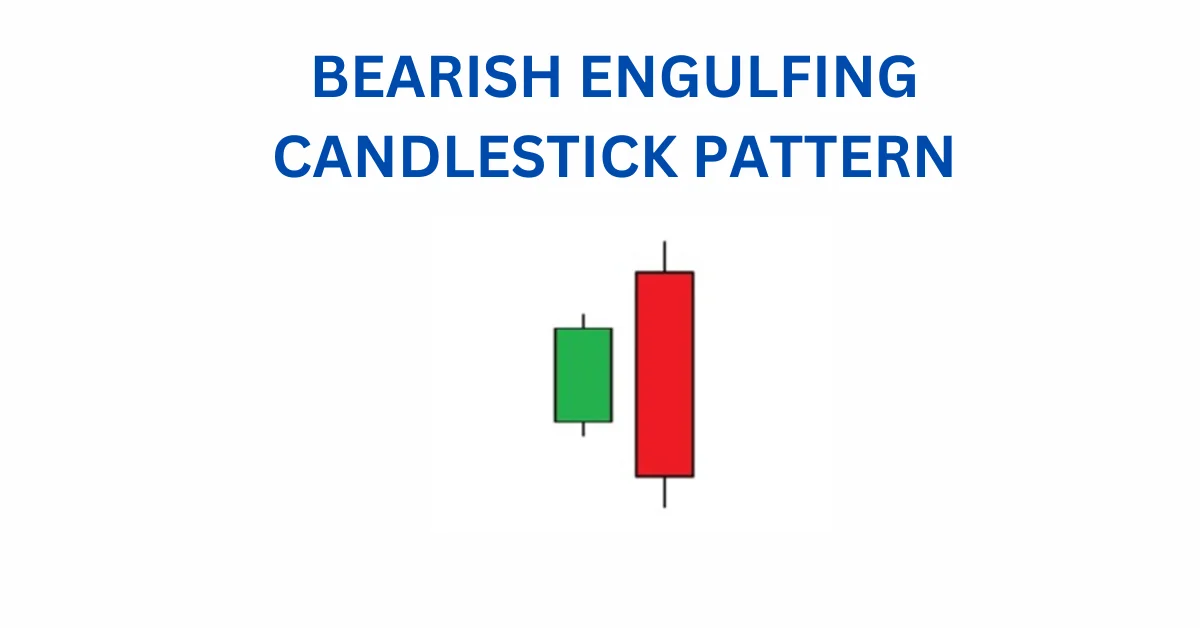
It consists of two candles.
The first one is bullish, suggesting the uptrend will continue.
The second candle is bearish, completely engulfing the first one, indicating a shift with bears gaining control.
Traders might consider entering a short position if the next day forms a bearish candle, placing a stoploss at the high of the second candle.
17. THE EVENING STAR
The Evening Star is a candlestick pattern that suggests a potential bearish reversal after an uptrend. Simplified explanation:
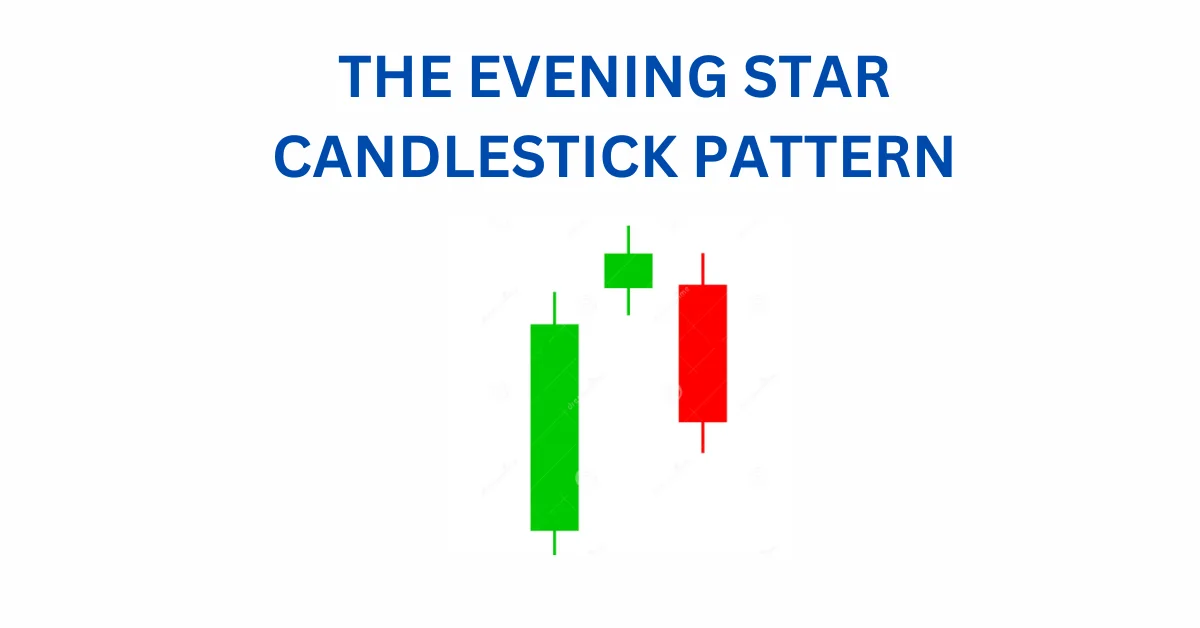
It consists of three candles.
The first one is bullish, indicating the uptrend’s continuation.
The second is a doji, signaling market indecision.
The third is bearish, showing bears are gaining control.
To consider a possible bearish reversal, traders might enter a short position if the next day forms a bearish candle, setting a stoploss at the high of the second candle.
18. THREE BLACK CROWS
The Three Black Crows is a candlestick pattern suggesting a potential bearish reversal after an uptrend. A simplified explanation:
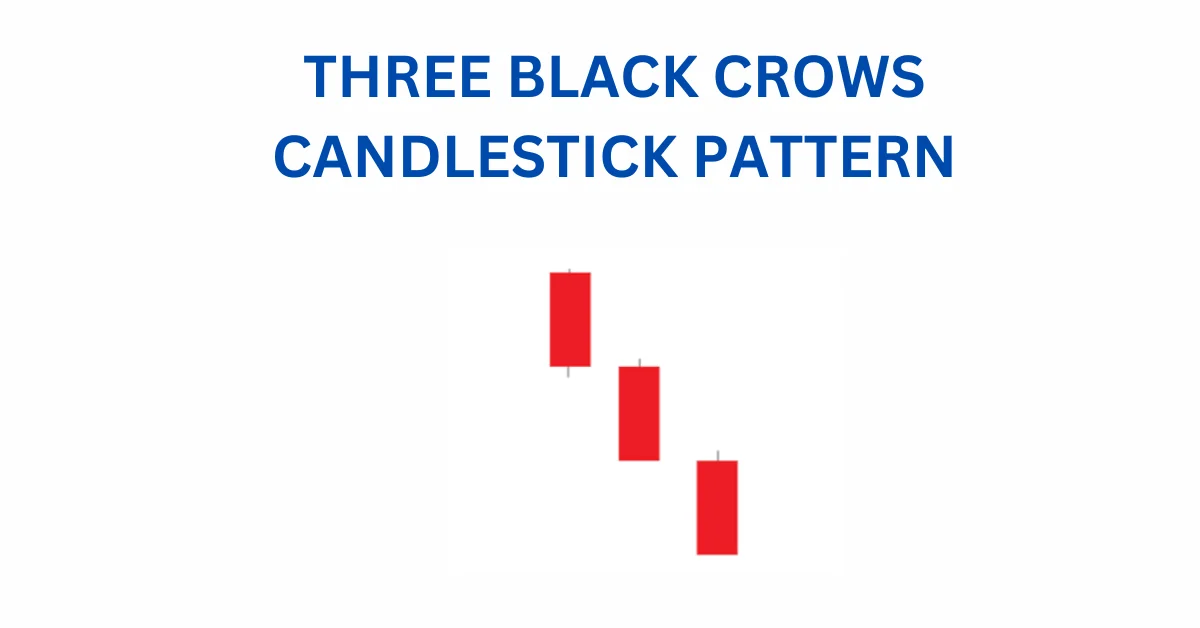
It consists of three candles.
All three are long and bearish.
They don’t have long shadows and open within the real body of the previous candle.
This pattern indicates a shift to a bearish trend.
19. BLACK MARUBOZU
The Black Marubozu is a single candlestick pattern signaling a potential bearish reversal after an uptrend. Here’s a simpler breakdown:
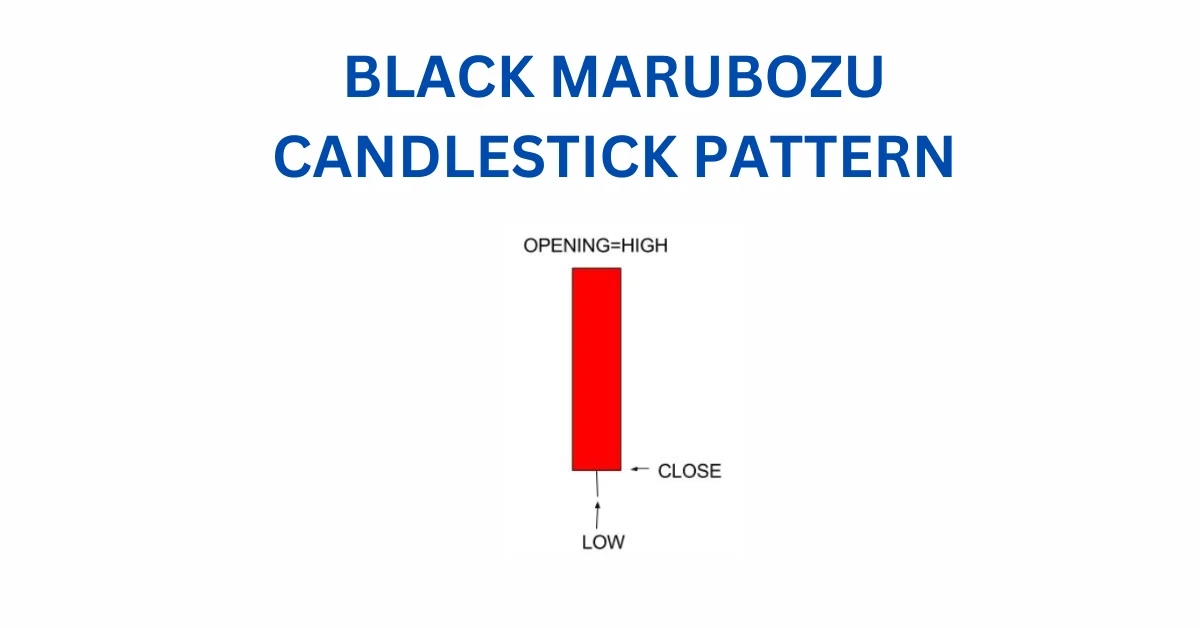
It’s a single candle with a long bearish body.
There are no upper or lower shadows.
This indicates strong selling pressure from bears, suggesting a possible shift to a bearish market.
When this candle forms, buyers should be cautious and consider closing their buying positions.
20. THREE INSIDE DOWN
The Three Inside Down is a candlestick pattern that suggests a possible bearish reversal after an uptrend. Here’s a simpler explanation:
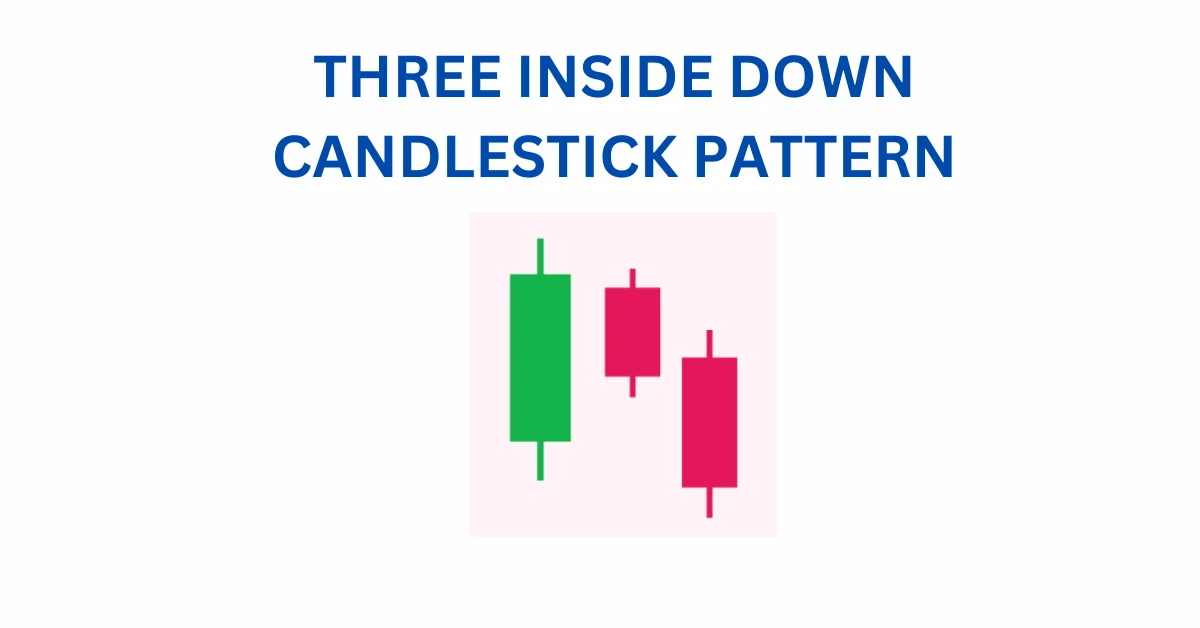
It involves three candles.
The first is a long bullish candle, showing the existing uptrend.
The second is a small bearish candle within the range of the first one.
The third is a long bearish candle, confirming the potential bearish reversal.
If you see this pattern, traders might consider taking a short position, anticipating a shift in the market.
21. BEARISH HARAMI
The Bearish Harami is a candlestick pattern that signals a possible bearish reversal after an uptrend. Here’s a simpler breakdown:
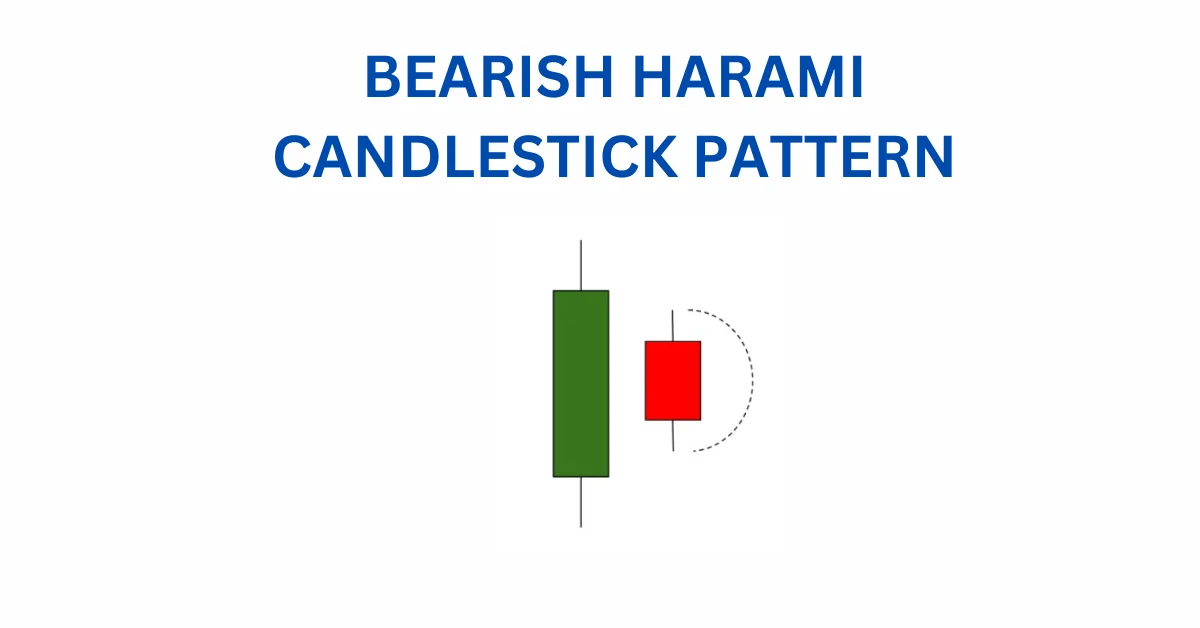
It involves two candles.
The first is a tall bullish candle, indicating the ongoing bullish trend.
The second is a small bearish candle within the range of the first one.
The first candle shows the continuation of the bullish trend, but the second one suggests a potential reversal as bears become active.
If traders spot this pattern, they might consider taking a short position, anticipating a shift in the market.
22. SHOOTING STAR
A Shooting Star is a candlestick pattern that appears at the end of an uptrend and suggests a potential bearish reversal. Here’s a simpler explanation:
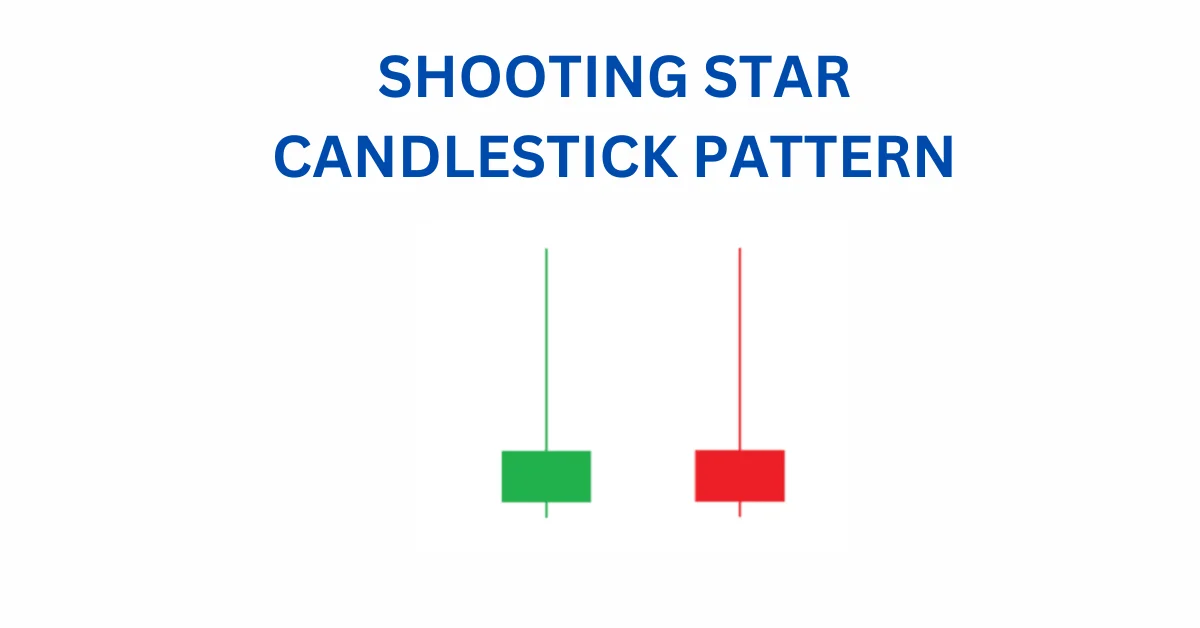
It looks like a candle with a small real body at the bottom and a long upper shadow.
It’s like the opposite of the Hanging Man Candlestick pattern.
This pattern happens when the opening and closing prices are close, and the upper shadow is more than twice the size of the real body.
23. TWEEZER TOP
The Tweezer Top pattern is a signal that the market might start going down after a period of going up. Here’s a simpler explanation:
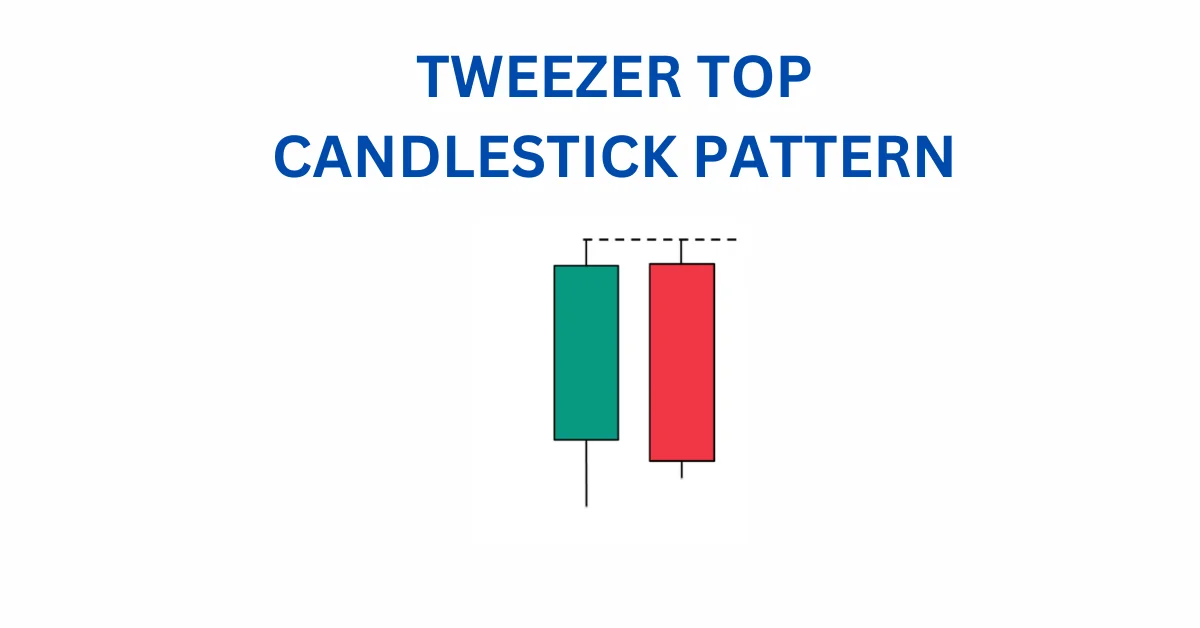
It happens after the market has been going up (uptrend).
There are two candles that look almost the same, one going up and the next one going down.
When this happens, it shows that the price might stop going up because there’s a strong level where people are not willing to buy at higher prices.
The candles with almost the same high tell us that the price might start going down, and this is confirmed when the next day a candle shows the price is indeed going down.
24. THREE OUTSIDE DOWN
The Three Outside Down is a sign that the market might change direction from going up to going down. Here’s a simpler explanation:
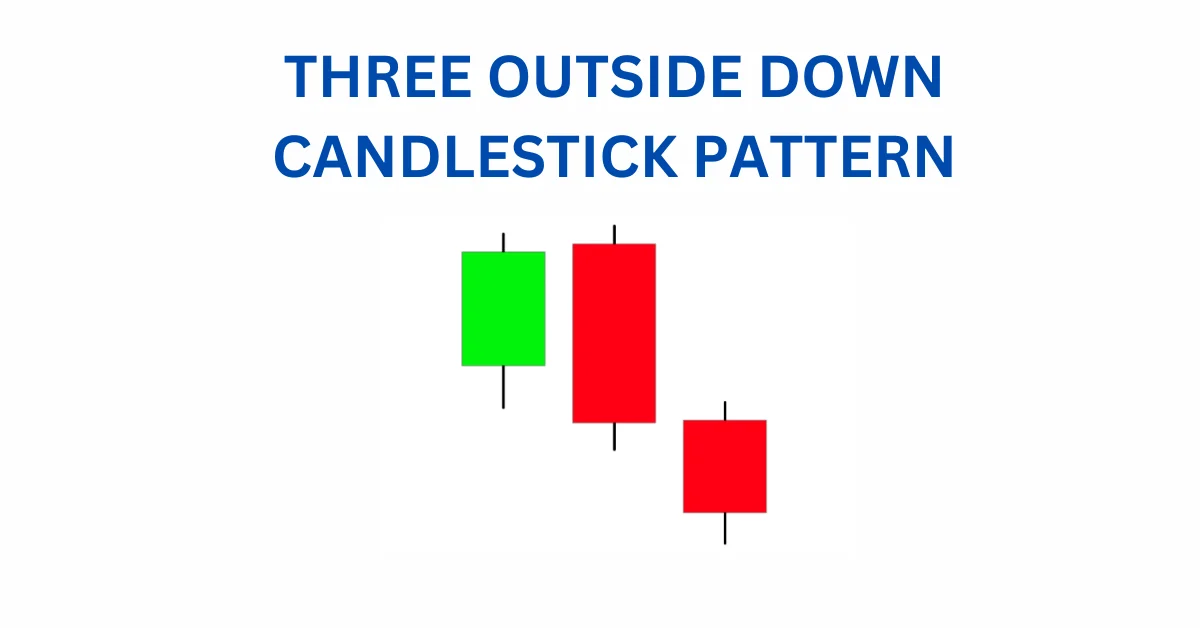
It happens after the market has been going up (uptrend).
There are three candles: first a small one going up, then a big one going down that covers the first one, and finally another big one going down.
This tells us that the price might stop going up because there’s a strong level where people are not willing to buy at higher prices.
The relationship between the first and second candles is like a big one eating the small one, and then the third candle confirms that the price might start going down.
Traders might decide to sell (take a short position) after seeing this pattern.
25. BEARISH COUNTERATTACK
The bearish counterattack is a signal that things might change from prices going up to prices going down. Let’s break it down in simpler terms:
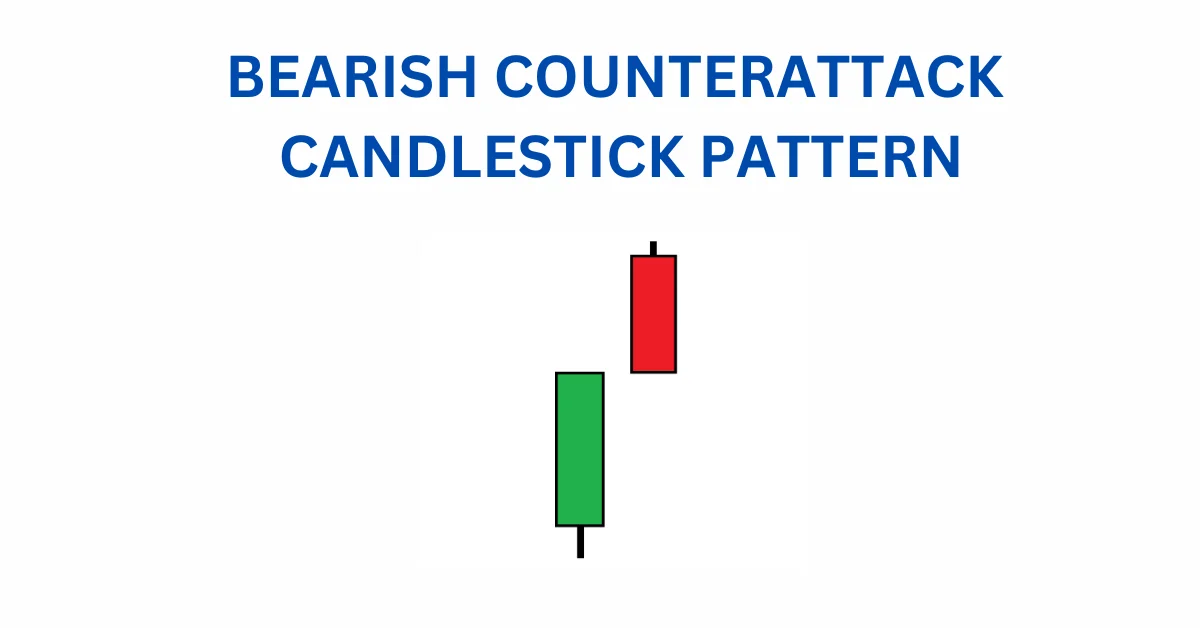
This pattern shows up when prices have been going up for a while (uptrend).
It suggests that the good times of prices going up might be ending, and now prices could start going down.
It’s like a warning sign for traders that the trend is shifting.
So, if you see this pattern, it might be a sign to consider selling (or taking a short position) because the trend could reverse.
26. DOJI
The Doji is a special candlestick that shows a battle between buyers and sellers. Here’s a simple breakdown:
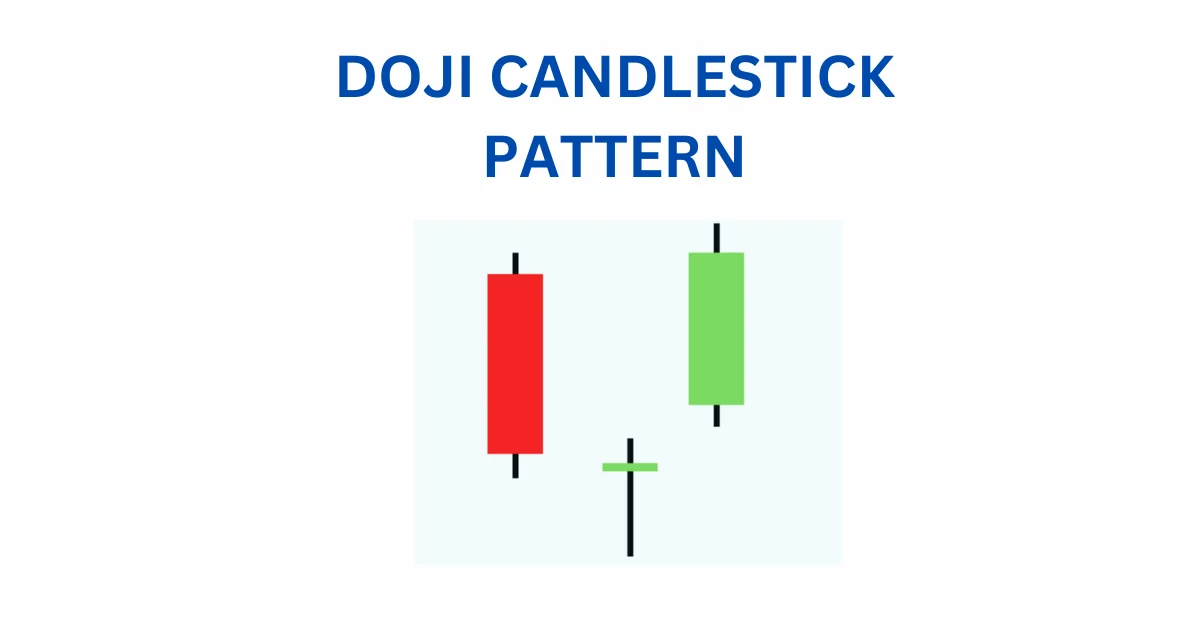
It happens when the opening price and closing price are very close.
Think of it as a little cross on the chart.
It tells us that buyers and sellers are in a bit of a fight, but neither side is winning.
It’s like a tiny flag saying, “We’re not sure which way prices should go.”
So, when you see a Doji, it’s a sign that the market is uncertain, and big moves might happen soon.
27. SPINNING TOP
The Spinning Top is like the Doji and shows that the market is unsure about where to go. Here’s the simple scoop:
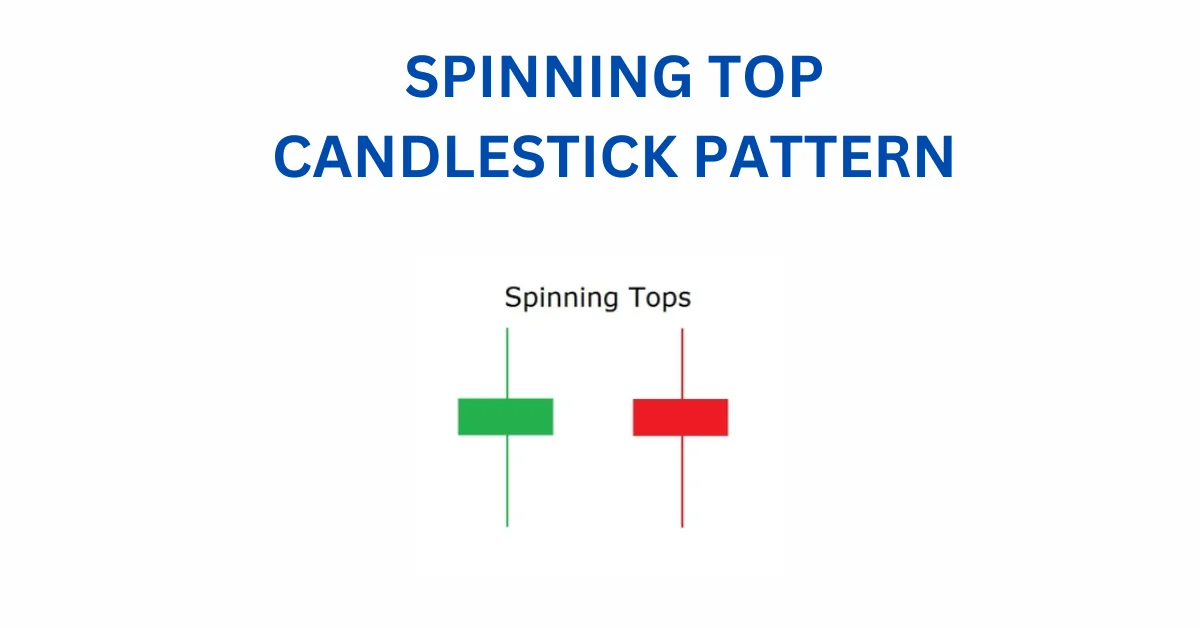
Just like the Doji, it points to uncertainty and a battle between buyers and sellers.
The only difference is that the Spinning Top has a slightly bigger middle part.
So, when you spot a Spinning Top, it’s another way of saying, “Hmm, we are still not sure which way prices want to move”.
28. FALLING THREE METHODS
The “Falling Three Methods” is a pattern that says, “Hold on, the downtrend is still going.” Here’s the simple version:
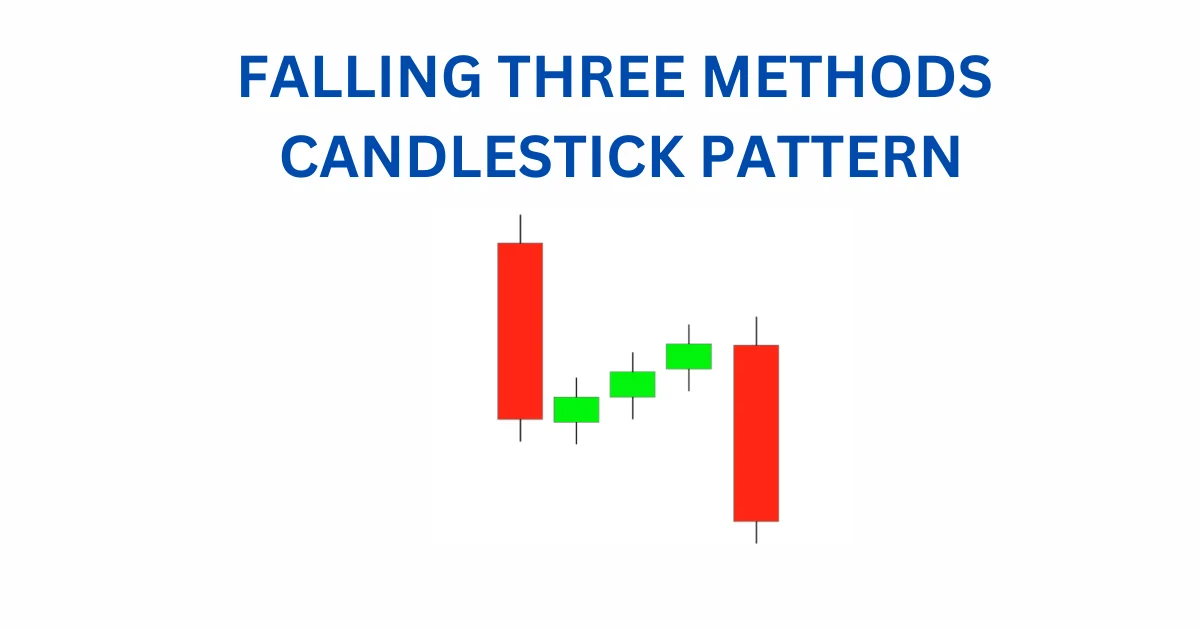
It’s made up of five candles.
The first and last candles are long and go in the same direction as the downtrend.
In the middle, you’ve got three smaller candles trying to go the other way.
What does it mean? Well, it’s like a timeout in a game. The bears are saying, “Nope, we’re still in control,” and the trend might keep going down.
29. RISING THREE METHODS
The “Rising Three Methods” is like a cheer for the uptrend. Here’s the simple scoop:
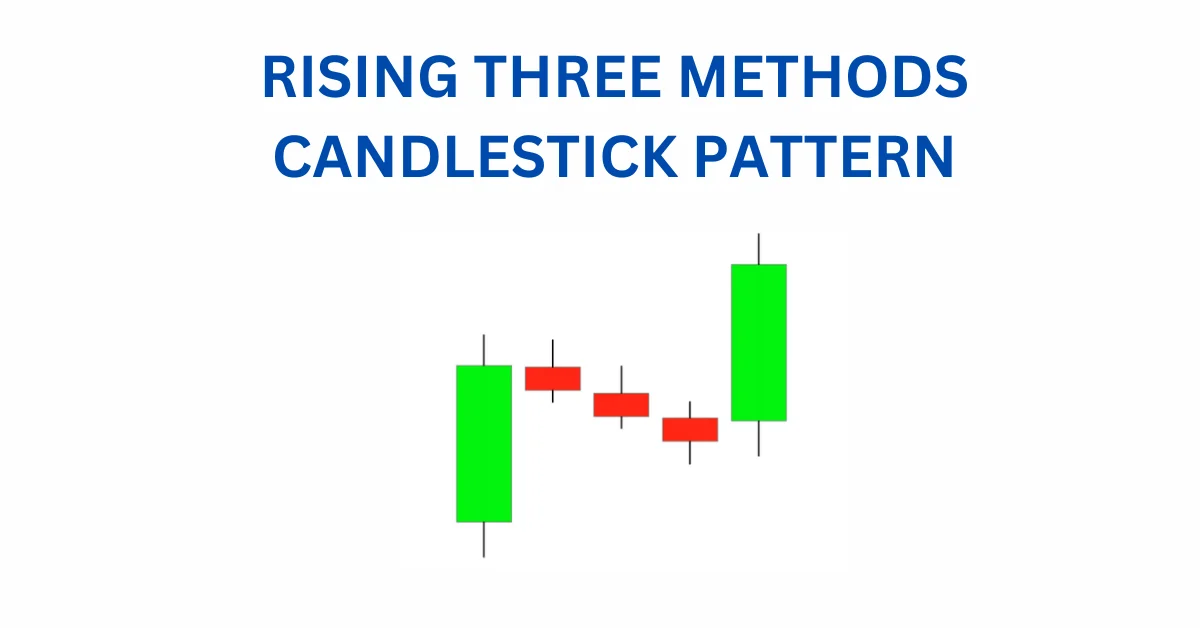
It’s got five candles in total.
The first and last candles are long and cheering for the uptrend.
In the middle, you’ve got three smaller candles trying to go the other way.
What’s the message? It’s like the bulls are saying, “We’re still in charge,” and the trend might keep going up.
30. UPSIDE TASUKI GAP
Imagine this pattern as a high-five for the uptrend. Here’s the lowdown:
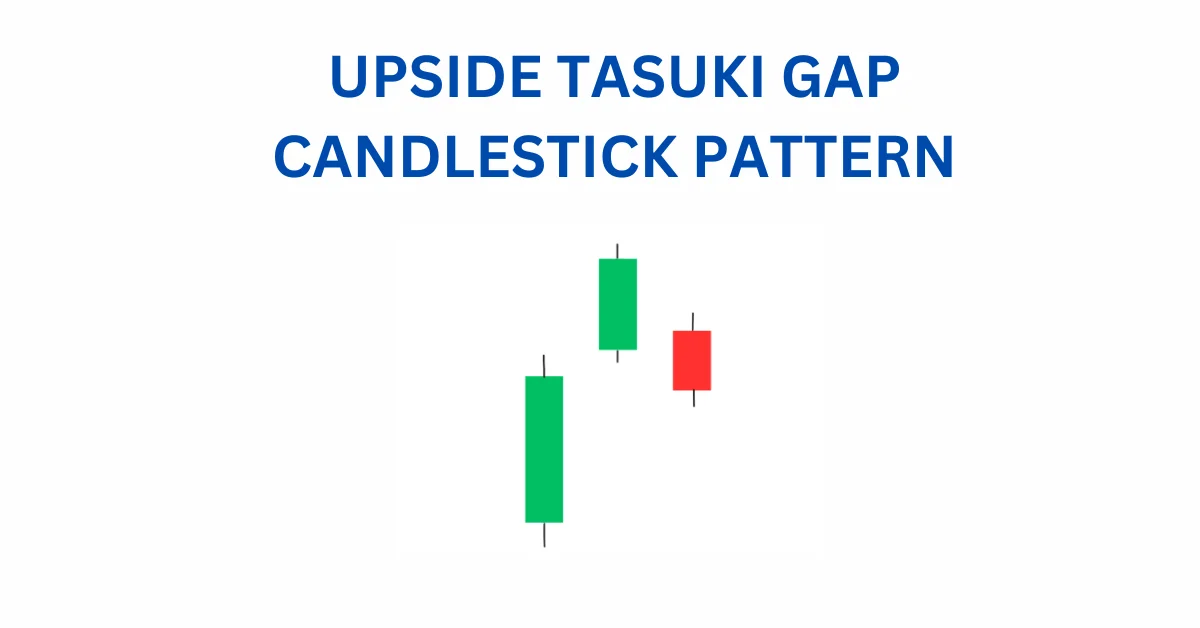
We are already on an uptrend.
First candle – a big, happy green one.
Next one – also a happy green one, but it starts with a little jump up.
Third one – a bit of a downer, red and closing in the gap between the first two.
What’s it telling us? Despite that small dip, the trend might keep on the sunny side.
31. DOWNSIDE TASUKI GAP
Now, let’s talk about a bit of a downer in a downtrend. Here’s the breakdown:
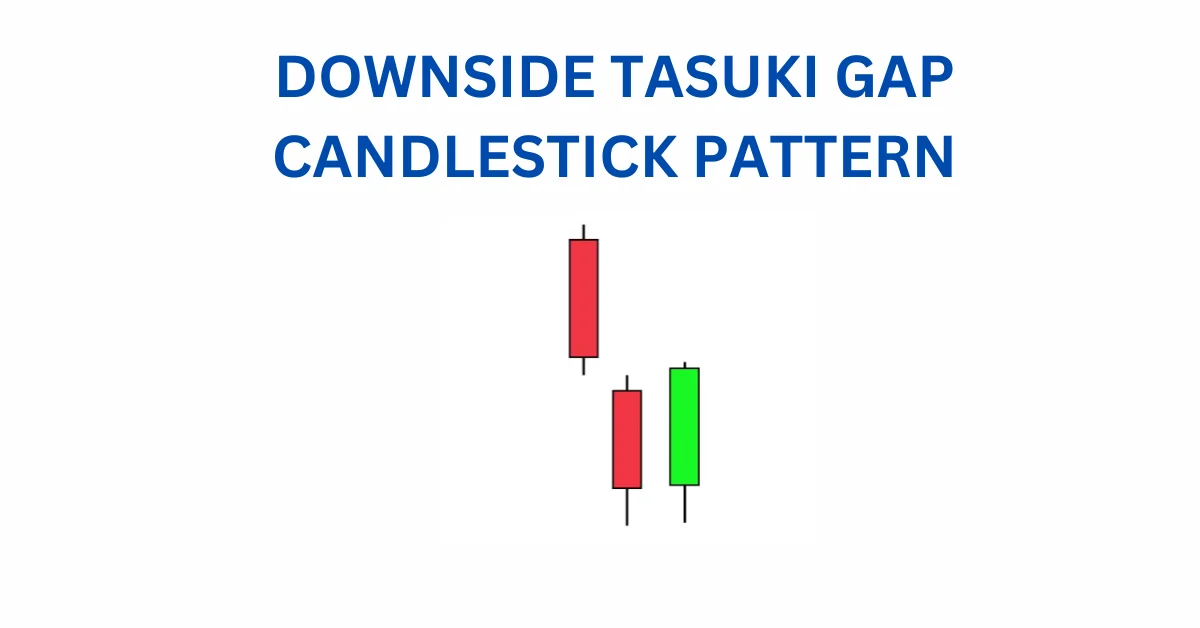
We are already heading down.
First candle – a big, gloomy red one.
Next one – another sad red one, but it starts with a little drop.
Third one – a touch of positivity, green and closing in the gap between the first two.
What’s the scoop? Even with that brief upswing, the downtrend might keep its gloomy vibe.
32. MAT-HOLD PATTERN
Alright, let’s dive into the Mat-Hold pattern – it’s like a story about keeping things going in the same direction.
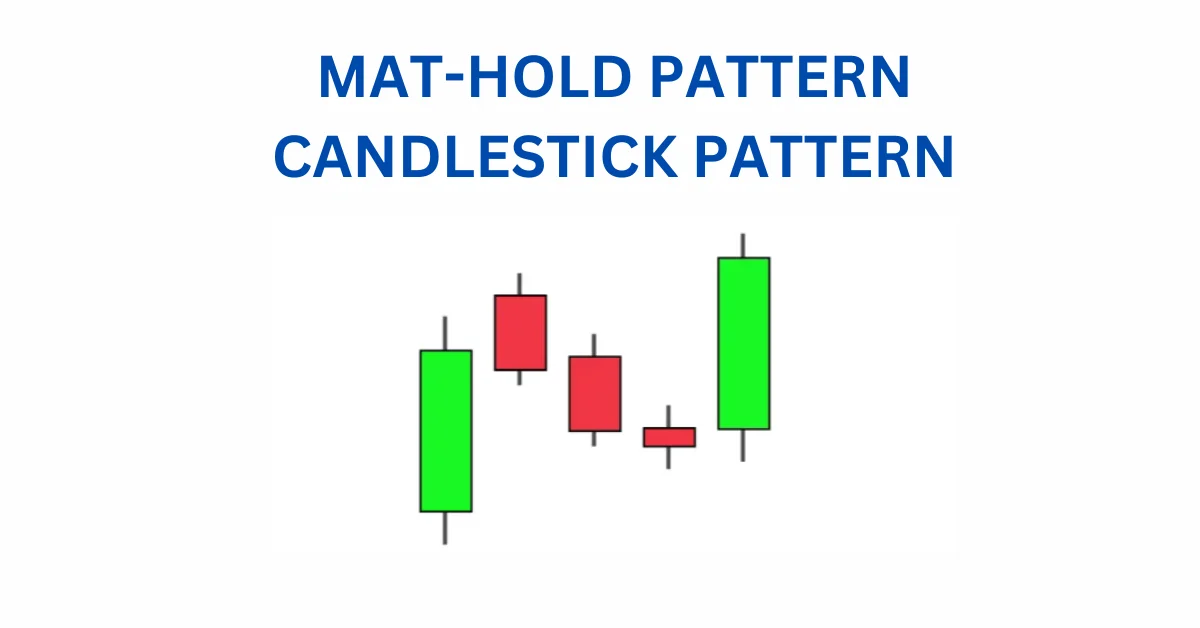
You have got two versions – one for the bears (the sellers) and one for the bulls (the buyers).
For the bullish version, start with a big green candle, then a gap up, and three smaller candles moving down. Important: All these little candles stay above the low of the first big green one.
Now, for the grand finale, the fifth candle shows up, and it’s another big one heading back up. It’s like a little rally within the bigger uptrend story.
The key? This pattern keeps the overall trend rolling, whether it’s a bullish or bearish tale.
33. RISING WINDOW PATTERN
This rising window is like a pair of friendly bullish candles with a little gap between them.
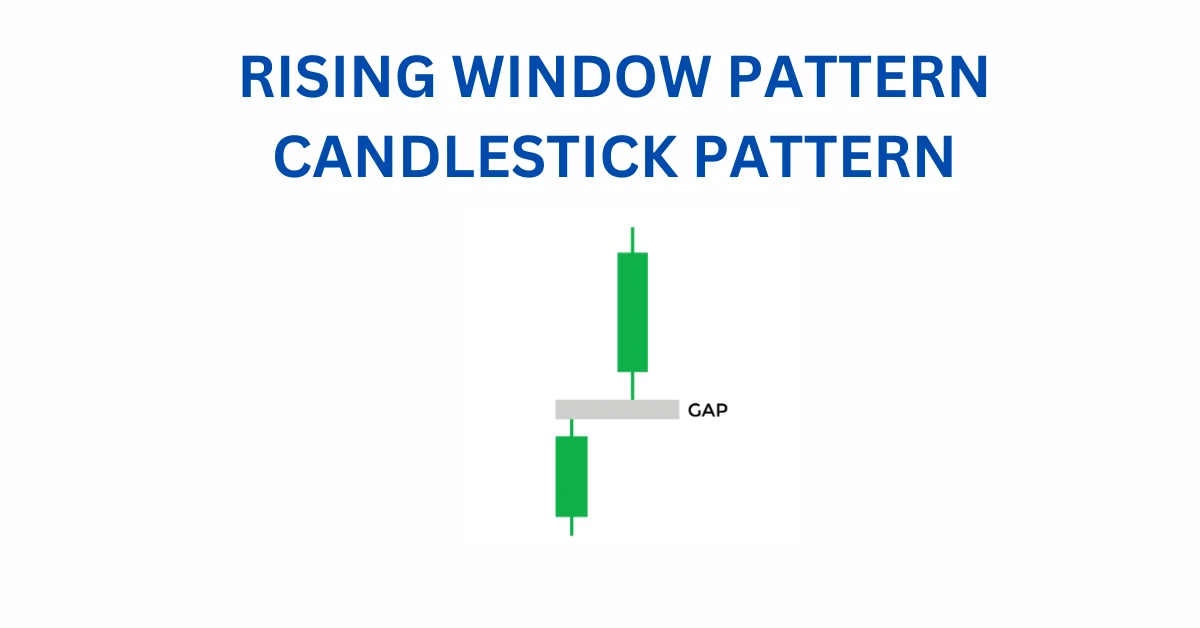
You have got two candles, both feeling pretty positive, and there’s this space between them. That gap happens when things get a bit wild in the trading world.
It’s a signal that the buyers are in charge, showing their strength. Think of it like a cheer from the buyers, saying, “Hey, we’re still going strong!”
So, when you see that rising window, it’s like a thumbs-up for the buyers, keeping the trend going strong.
34. FALLING WINDOW PATTERN
Imagine two bearish candles taking a bit of a space break – that’s the falling window.
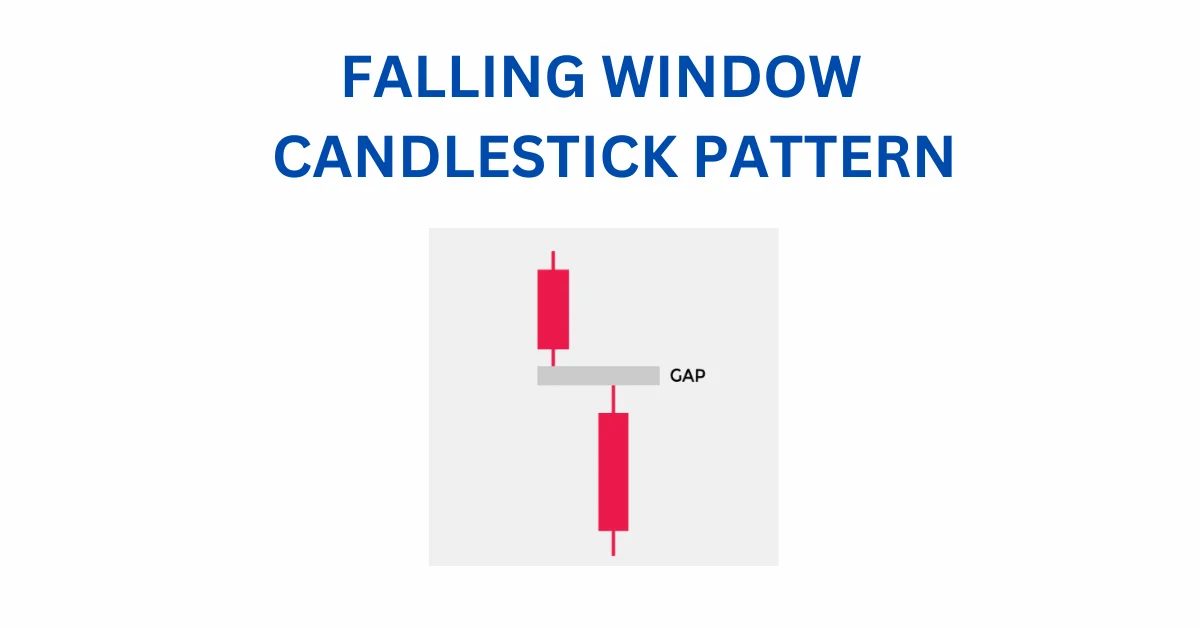
You have got these two candles, both in a bit of a bearish mood, and there’s a gap between them. That gap pops up when trading gets a bit wild and unpredictable.
It’s a sign that the sellers are flexing their muscles, showing their strength. It’s like a message from the sellers saying, “We’re in control here!”
So, when you spot that falling window, it’s like a signal that the sellers are going strong, keeping the trend on a bearish path.
35. HIGH WAVE PATTERN
Ever felt like the market couldn’t make up its mind? That’s the high wave pattern talking.
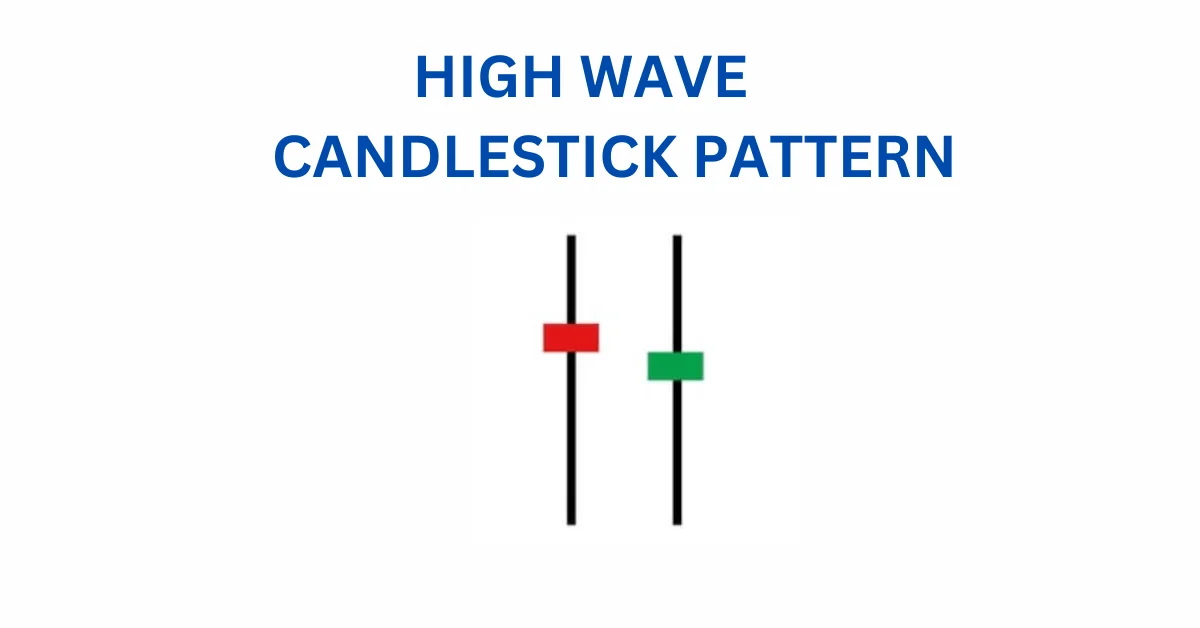
This pattern screams indecision. The market is like, “Should we go up or down? Let’s take a break!”
It often happens at spots where the market has hit pause before, like support and resistance levels. Bulls and bears are in a tugofwar, each trying to drag the price their way.
Picture this: long shadows at the bottom and top of the candlestick, and a tiny body in the middle. It’s like saying, “Yep, there was a lot of back-and-forth, but in the end, we’re back where we started.”
So, when you spot a high wave, it’s like the market’s way of saying, “I can’t decide!”
CONCLUSION ON 35 POWERFUL CANDLESTICK PATTERNS
In the dynamic world of financial markets, understanding and interpreting price movements is akin to deciphering a complex language.
Among the myriad tools available to traders, candlestick patterns stand out as a powerful and visually compelling method for gauging market sentiment.
Throughout this exploration of 35 candlestick patterns, we’ve delved into the intricate dance of buyers and sellers, learning to read the story told by the interplay of bullish and bearish formations.
Candlestick patterns are not merely clusters of shapes on a chart; they are reflections of the collective psychology of market participants.
Each pattern narrates a tale of struggle, whether it be the tug-of-war between bulls and bears, the indecision at key support and resistance levels, or the potential reversal of prevailing trends.
Let’s recap some key takeaways from our journey through these patterns.
Understanding the Language of Candlesticks
Candlestick charts originated centuries ago in Japan, and their popularity has only grown over time. These visual representations of price action provide a snapshot of market sentiment during a specific period.
The “real body” of a candlestick, representing the difference between the opening and closing prices, is the focal point, while the shadows or wicks convey the price extremes reached.
Bullish Reversal Patterns
We explored various bullish reversal patterns that signal a potential shift from a downtrend to an uptrend.
From the simplicity of the Hammer, symbolizing a potential end to a downtrend, to the more complex Morning Star formation, consisting of three candles hinting at a bullish reversal, each pattern tells a unique story.
Traders looking to capitalize on these signals might initiate long positions, anticipating upward price movements.
Bearish Reversal Patterns
Conversely, bearish reversal patterns indicate the possible end of an uptrend, ushering in a potential downtrend.
Patterns like the Hanging Man and Dark Cloud Cover warn of impending bearish momentum. For traders, recognizing these patterns could signal an opportunity to take short positions and profit from anticipated downward movements in prices.
Continuation Patterns
Not all patterns imply a reversal. Continuation patterns, such as the Three White Soldiers or Three Black Crows, suggest that prevailing trends are likely to persist.
Traders who identify these patterns might choose to stay in their current positions or consider adding to them, aligning their strategies with the prevailing market direction.
Candlestick Indecision
Patterns like the Doji and Spinning Top reveal market indecision.
When bulls and bears are in a standoff, these patterns manifest as small-bodied candles with long shadows.
Traders interpreting these signals might exercise caution, recognizing that the market is grappling with conflicting forces.
Candlestick Patterns in Trend Analysis
Understanding the context is crucial. The direction of the preceding trend influences the significance of a pattern.
For instance, a Bullish Engulfing pattern carries more weight when it emerges after a prolonged downtrend, signaling a potential reversal. Similarly, a Bearish Harami gains relevance when it interrupts a bullish trend, hinting at a possible downturn.
Key Considerations for Traders
While candlestick patterns provide valuable insights, successful trading requires a holistic approach.
Traders should consider factors such as market fundamentals, economic indicators, and broader trends. Risk management strategies, including the use of stop-loss orders, are essential to mitigate potential losses.
Continuous Learning and Adaptation
The financial markets are dynamic, influenced by a myriad of factors. Traders must be adaptable, continuously learning and refining their strategies.
Candlestick patterns are one tool in the trader’s arsenal, and combining them with technical analysis, fundamental analysis, and risk management strategies enhances decision-making capabilities.
The world of candlestick patterns is a rich tapestry woven with the threads of market dynamics, human psychology, and economic forces.
Each pattern, whether bullish, bearish, or indicative of market indecision, adds a layer to the intricate story unfolding on price charts.
As traders navigate the complexities of financial markets, the mastery of candlestick patterns serves as a valuable skill, enabling them to decode the nuanced language of price action and make informed decisions in the pursuit of trading success.