Dear Readers welcome, in this article we will provide information related to Profit Volume Ratio.
In simple words, Profit Volume Ratio, or P/V Ratio, tells us how much profit a business makes when it sells more or less of its products or services.
It is like a measure of how well a company is doing financially, considering things like costs and sales.
FIXED COSTS AND VARIABLE COSTS: THE PILLARS OF PROFITABILITY
Profitability in business hinges on understanding the dynamics between fixed costs and variable costs. Fixed costs are those expenses that remain constant, regardless of the volume of production or sales.
On the other hand, variable costs are directly related to sales levels and play a crucial role in determining profitability when fixed costs remain unchanging.
WHAT IS PROFIT VOLUME RATIO (P/V RATIO)?
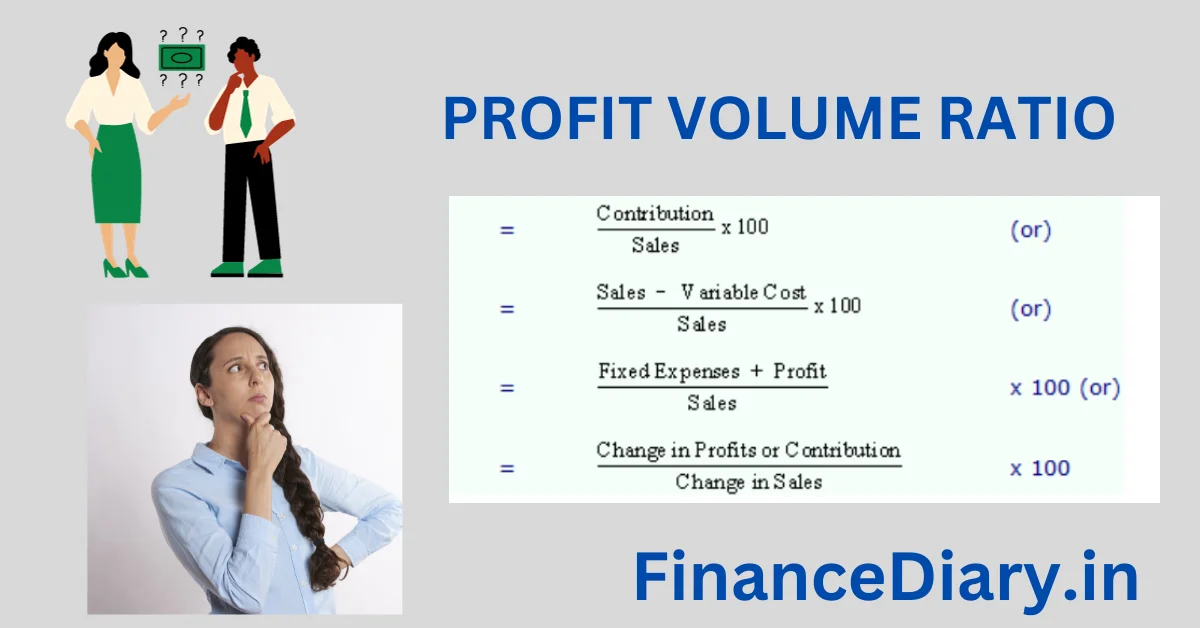
The Profit Volume (P/V) Ratio is a vital metric for evaluating how changes in sales volume impact profitability.
It is often referred to as the Profit Volume Ratio (P/V Ratio), and it establishes the relationship between sales and contribution, which is the difference between the sale price and variable cost.
PV RATIO FORMULA
The formula to calculate the P/V Ratio is:
P/V Ratio = (Contribution / Sales) x 100
For instance, if a product is sold at Rs. 80 with a variable cost of Rs. 60, the P/V Ratio is calculated as follows:
(80 – 60) × 100 / 80 = 20 × 100 / 80 = 25%
This ratio indicates the percentage of contribution to sales, and a higher P/V Ratio implies a more substantial profit margin, while a lower P/V Ratio suggests a narrower profit margin.
SIGNIFICANCE OF PROFIT VOLUME RATIO
Understanding the P/V Ratio is crucial because it helps in assessing the profitability of a business, especially when fixed costs remain constant.
A high P/V Ratio signifies a healthy profit margin, while a low P/V Ratio indicates a less favourable margin.
In situations where the margin is low, companies can either raise their selling prices to improve the P/V Ratio or increase sales turnover to achieve satisfactory profits.
CALCULATING THE BREAKEVEN POINT (BEP)
The breakeven point is the sales level at which a company covers its total costs, resulting in neither profit nor loss.
To calculate the breakeven point, you can use the following formula:
BEP = Fixed Costs / (Price per Unit – Variable Costs)
For example
If a company’s fixed costs are Rs. 250,000, the price per unit is Rs. 10, and the variable cost per unit is Rs. 6, the breakeven point can be calculated as follows:
BEP = 250,000 / (10 – 6) = 250,000 / 4 = 62,500 units
This means that the company must sell 62,500 units at Rs. 10 per unit to reach the breakeven point.
MARGIN OF SAFETY (MOS): THE CUSHION OF PROFITS
Margin of safety (MOS) is the difference between actual sales and the breakeven sales.
In other words, it represents the amount of sales revenue beyond the breakeven point, serving as a cushion for profits.
MOS = Actual Sales – Breakeven Sales
Using the example provided earlier, where the breakeven point was 62,500 units, if actual sales amount to Rs. 1,000,000, the Margin of Safety (MOS) is calculated as:
MOS = 1,000,000 – (10 × 62,500) = 1,000,000 – 625,000 = Rs. 375,000
Another way to calculate MOS is by using the formula:
MOS = Profit / P/V Ratio
If the company’s profit is Rs. 150,000, and the P/V Ratio is 40%, then:
MOS = 150,000 / 40% = Rs. 375,000
The Margin of Safety serves as a safety net, indicating how much sales can drop before the company incurs losses.
Video Credit: Beauty with Brains
ALSO READ
PROFIT VOLUME RATIO CONCLUSION
The Profit Volume Ratio, often referred to as the P/V Ratio, plays a pivotal role in assessing a business’s profitability by considering fixed costs, variable costs, and their impact on the breakeven point and margin of safety.
By understanding these concepts and utilizing them effectively, businesses can make informed decisions to enhance profitability and navigate financial success.
