
Dear Readers in this article we will provide the information related to the Nifty 50 Returns in last 20 years.
Investors often delve into the historical performance of stock market indices to gain insights into market trends, assess risk, and make informed investment decisions.
The Nifty 50, comprising 50 of India’s largest and most liquid stocks across various sectors, is a key benchmark index reflecting the performance of the Indian equity market.
Analyzing its returns over the past two decades provides valuable insights into the market’s behavior and potential opportunities for investors.
EXPLORING ANNUALIZED RETURNS
The Compound Annual Growth Rate (CAGR) is a widely used metric to measure the average annual growth rate of an investment over a specified period.
Let’s delve into the annualized returns of the Nifty 50 from 1996 to 2023 to understand its performance over the last 20 years.
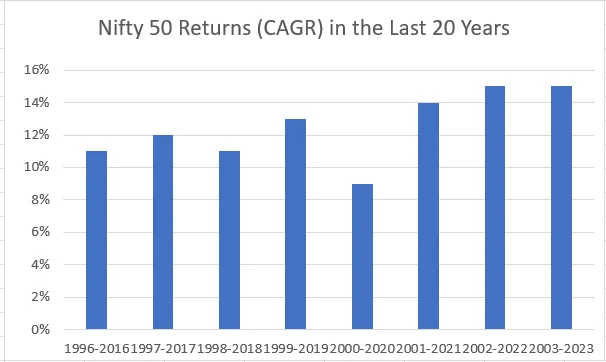
| Year | Nifty 50 Returns (CAGR)
in the Last 20 Years |
| 1996-2016 | 11% |
| 1997-2017 | 12% |
| 1998-2018 | 11% |
| 1999-2019 | 13% |
| 2000-2020 | 9% |
| 2001-2021 | 14% |
| 2002-2022 | 15% |
| 2003-2023 | 15% |
1996-2016: 11% CAGR
During the period from 1996 to 2016, the Nifty 50 exhibited a commendable performance with a Compound Annual Growth Rate (CAGR) of 11%.
This signifies that on average, the index delivered an annual return of 11% over this two-decade span.
Despite facing various economic and geopolitical challenges, the Nifty 50 managed to generate consistent returns for investors, reflecting the resilience of the Indian stock market.
1997-2017: 12% CAGR
From 1997 to 2017, the Nifty 50’s CAGR slightly improved to 12%, indicating a modest uptick in its average annual returns.
This period witnessed several significant developments, including economic reforms, technological advancements, and increased foreign investment inflows, which contributed to the index’s growth trajectory.
ALSO READ :
MUTUAL FUND DISTRIBUTOR-CHOICE
1998-2018: 11% CAGR
Maintaining its momentum, the Nifty 50 sustained an 11% CAGR from 1998 to 2018. Despite occasional market corrections and volatility, the index continued to deliver robust returns to investors, driven by factors such as corporate earnings growth, sectoral developments, and macroeconomic trends.
1999-2019: 13% CAGR
The turn of the century ushered in a period of accelerated growth for the Nifty 50, with a CAGR of 13% from 1999 to 2019.
This decade witnessed significant economic expansion, demographic shifts, and technological disruptions, all of which contributed to the index’s stellar performance and heightened investor optimism.
2000-2020: 9% CAGR
Despite global economic challenges and domestic policy changes, the Nifty 50 maintained a respectable CAGR of 9% from 2000 to 2020.
While the average annual returns were slightly lower compared to previous periods, the index continued to generate positive returns for investors, albeit at a more moderate pace.
2001-2021: 14% CAGR
The subsequent decade witnessed a resurgence in the Nifty 50’s performance, with a robust CAGR of 14% from 2001 to 2021.
Favourable government policies, structural reforms, and strong corporate earnings propelled the index to new heights, attracting both domestic and international investors seeking exposure to India’s growth story.
2002-2022: 15% CAGR
Building upon the positive momentum, the Nifty 50 continued its upward trajectory with a remarkable CAGR of 15% from 2002 to 2022.
This period was characterized by sustained economic growth, favourable demographic trends, and increasing investor confidence, driving the index to record levels and creating wealth for investors.
2003-2023: 15% CAGR
The most recent analysis spanning from 2003 to 2023 reaffirms the Nifty 50’s stellar performance, with a consistent CAGR of 15%.
Despite periodic market corrections and global uncertainties, the index demonstrated resilience and delivered commendable returns to investors, underlining its status as a preferred investment avenue.
IMPLICATIONS FOR INVESTORS
Understanding the historical returns of the Nifty 50 over the last 20 years provides valuable insights for investors and portfolio managers. Here are some key implications:
Long-Term Investment Potential
The Nifty 50 has demonstrated robust long-term growth potential, making it an attractive investment option for individuals with a horizon of 20 years or more.
Diversification Benefits
Including Nifty 50 stocks in a diversified portfolio can help mitigate risk and enhance overall returns, especially over extended investment horizons.
Market Volatility Management
Analysing historical returns enables investors to navigate market volatility more effectively and make informed decisions based on past performance trends.
Periodic Portfolio Review
Periodically reviewing and rebalancing investment portfolios in line with the Nifty 50’s performance can optimize returns and align with changing market dynamics.
CONCLUSION ON NIFTY 50 RETURNS IN LAST 20 YEARS
In conclusion, the Nifty 50’s returns over the last two decades underscore its resilience, growth potential, and significance as a barometer of India’s equity markets.
By leveraging this historical data, investors can formulate prudent investment strategies and capitalize on future opportunities in the dynamic world of finance.